- Global risks, local realities: Climate change impacts geographies and industries unevenly. High-resolution climate damage projections uncover specific vulnerabilities.
- Building resilience to physical shocks: Enhanced projections enable businesses, governments, and investors to anticipate and manage localised climate risks.
- Quantifying uncertainty by design: Treating uncertainty as an integral part of climate projections enables decision-makers to manage risks more effectively.
- Physical is essential: Early integration of high-resolution insights enables investors to address localised and sectorspecific climate risks proactively.
Climate change is a global phenomenon, but its impacts are profoundly uneven, varying significantly across regions and industries. Global averages often obscure these disparities, failing to capture the localised and sector-specific vulnerabilities that matter most to decision-makers. Recent advances in data, modelling and computing allow for unprecedented granularity in physical risk assessments. These tools not only enhance our ability to anticipate localised climate shocks but also empower decision-makers to allocate resources effectively, identify adaptation opportunities and build resilience.
We present the first replication of the influential study by Kotz et al (2024), which has become a benchmark in climate economics and is now integrated into prudential analyses. Beyond replication, our work validates the robustness of their findings by testing their sensitivity to various datasets and assumptions. Building on this solid foundation, we extend the analysis of physical risks and damages to an unprecedented level of spatial granularity, uncovering new insights into intra-regional climate variability. By aggregating damages from the bottom up, we refine global physical risk estimates, revealing more severe outcomes than prior studies. Importantly, this high-resolution modelling provides actionable insights for policymakers, businesses and investors aiming to adapt to climate change and mitigate risks.
Overall, this article explores how spatially granular climate insights can transform the way business, administrations and investors approach climate risk management. By integrating these insights early, stakeholders can not only address immediate vulnerabilities but also position themselves at the forefront of climate adaptation and resilience.
Beyond and beneath global averages: localising climate risk for better decision-making
Global production systems, particularly weather-sensitive sectors such as food and energy, are projected to face mounting challenges from rising demand and the impacts of a changing climate over the coming decades (Bodirsky et al [2015]). Global warming is predicted to make extreme heat events more frequent and intense over the course of this century (Orlowsky and Seneviratne [2012]). Climate shocks however will be heterogeneously distributed across space and sectors. Understanding and anticipating these localised and sector-specific vulnerabilities is crucial to navigating this shifting risk environment – this is where we find our contribution.
Recent advances in large-scale spatial econometric regressions and the development of global climate databases have brought about a significant shift in the climate-economics literature. Increased level of spatial granularity and a finer understanding of the potential climate drivers of global productivity have gone beyond standard predictions of global averages. Just as Quetelet’s ‘average man’ represents no real individual, global predictions of climate change economic impacts fail to reflect the specific vulnerabilities and risks faced by individual regions or sectors. However, the implications of these new-generation tools for regional economic outputs remained unknown until quite recently.
The challenge is partly technological: the most recent raw climate data, whether observed or projected, offer daily or even hourly frequencies and spatial resolutions of 1km x 1km, resulting in terabyte-sized datasets.[1] Processing these datasets requires advanced computational tools, such as high-performance computing (HPC) systems and shared computing clusters (SCCs). These tools enable researchers to incorporate millions of climate simulations into global economic models, linking macro-financial outcomes to year-to-year fluctuations in climate exposure. When applied effectively, these innovative approaches significantly enhance the precision of regional risk assessments, providing high-resolution projections of future impacts on production systems and asset performance. Moreover, these projections are grounded in robust empirical data, offering insights that go beyond theoretical estimations. Together, these advancements underscore the strong competitive edge offered by the granular modelling methods at the core of our research.
Early climate models focused on agriculture and relied on country-level data. These studies consistently showed a non-linear relationship between temperature and crop productivity: as growingseason temperatures rose, crop yields and farmland values declined at an accelerating rate (Schlenker and Roberts [2009]; Burke and Emerick [2016]; Mendelsohn and Massetti [2017]). The findings suggested that rising temperatures would reduce the profitability of croplands due to direct productivity losses (and thus production) causing major ‘global’ crop caloric supply disruptions with implications for food prices and land supply. However, these so-called ‘global’ estimates were actually based on US and EU agriculture data, and thus hardly extendable to other regions or sectors.
Broader implications came with a new generation of damage models ushered in by the work of Burke et al (2015), who scaled up the non-linear microeconomic relationship reported in the agriculture sector into macro-level damages covering the wider economy (namely gross domestic product [GDP]). They were the very first to establish a direct link between country-level GDP damages and temperature exposure, and to use the predictive structure of their equations to extrapolate the macroeconomic implications of shifts in temperature to a global level (166 countries). Among their key results, they empirically confirmed the non-linear amplifying effect of temperature on aggregate economic production and thus enabled a major move forward in the climate-economics literature. From a methodological standpoint, they showed that a ‘bottom-up’ approach produces consistent results, as it averages grid-celllevel climatic exposure by country (while accounting for intra-country population density distribution), prior to aggregating up country-level projected GDP damages globally. But, most importantly, Burke et al (2015) also found that global estimates of GDP losses obtained by aggregation were higher than those produced by standard implementations of integrated assessment models (IAMs), which simulate the interactions between climate change and the macroeconomy at a high level.
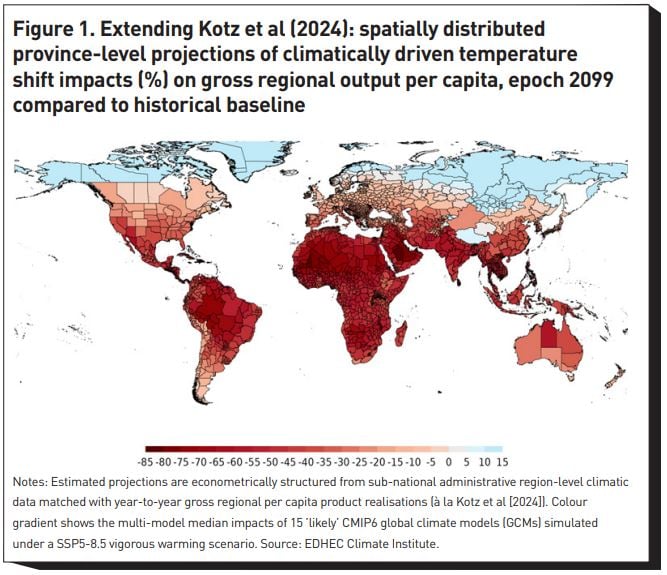
Kotz et al (2024) expanded on Burke et al (2015) by conducting their analysis at a much finer spatial resolution – 1,660 sub-national administrative areas instead of 166 countries. This approach produced the first-ever intra-country distribution of projected gross regional product damages from future climate shifts. More than simply offering a clearer view of regional variations, their work demonstrated that using higher spatial resolution (eg, provinces instead of countries) results in larger estimates of globally aggregated damages. This finding highlights how more granular data and advanced impact estimation methods not only enhance our understanding of local climate risks but also provide a more accurate assessment of global climate change damages. In our research, we have taken this evolution one step further. First, for consistency, we have reproduced the pioneering Burke et al (2015) and Kotz et al (2024) temperature-per-capita GDP response functions published in Nature and we have confirmed their robustness by testing different gridded climate fields data and collapsing methods, as well as econometric specifications of the constant terms in the panel framework. Second, for innovation, we have extended projections of economic damages from 1,660 to 3,672 sub-national provinces. By doing so, our geographic coverage contains provinces responsible for 95% of global economic production (see figure 1). The resulting global damage function exhibits a slightly more severe shape than in Kotz et al (2024). Our work shows that accounting for small-scale variations in localised climatic exposure and intra-country economic heterogeneity yields aggregated losses that substantially alter the conclusions of previous global GDP models. By way of illustration, considering end-ofcentury damages under RCP8.5 and employing the most relevant model specifications, our globally averaged estimated economic damages reach 67% of GDP, compared to 25% in Burke et al (2015). This demonstrates the transformative benefits of high resolution-based modelling. Our figures are comparable to the approximately 62% damages in Kotz et al (2024), with remaining differences reasonably attributable to the finergrained spatial distribution of our projection analysis (notably, we recover their results when adopting their resolution). The resulting global damage function exhibits a slightly more severe shape than in Kotz et al (2024). Therefore, our work shows that accounting for small-scale variations in localised climatic exposure and intra-country economic heterogeneity yields aggregated losses that substantially alter the conclusions of previous global GDP models – including those of Burke et al (2015).
In sum: our work has dual importance and progresses our understanding in two opposite directions: downwards, towards higher spatial granularity; and upwards, towards more accurate global assessments of climate risk impacts on economic production.
Quantifying mid-century physical risks for better adaptation
Kotz et al (2024) represents a breakthrough in climate economics, influencing our research in three main ways. First, they extend the country-level temperature-GDP response functions of Burke et al (2015) to provinces, highlighting their heterogeneous exposure to climate shocks.
Second, they incorporate components of extreme weather events – such as the annual number of wet days, extreme daily rainfall and daily temperature variability – into their empirical framework, addressing factors previously excluded from climate econometric analyses. When projecting climate-driven changes in per capita regional output, they combined their estimated responses with global climate model simulations, incorporating not only average temperature anomalies but also future changes in the frequency and intensity of extreme weather events and the lasting effects of climate shocks.
Third, the Network for Greening the Financial System (NGFS) incorporated the Kotz et al (2024) damage function into its latest generation of climate scenarios (Phase V), recognising its ability to comprehensively capture physical risk impacts on the economy. Outputs from this revised ‘climate scenario engine’ have significant implications for central banks, policymakers and investors.
Building on these developments, our work contributes in several key areas: (i) we cross-check the validity of their results using alternative climate data products and statistical models, including parametric, non-parametric and semi-parametric approaches; (ii) we expand the spatial resolution and geographic coverage of projected economic damages; (iii) we refine the granularity of the latest simulations of the Intergovernmental Panel on Climate Change (IPCC), while addressing biases in models that tend to overestimate warming (‘hot models’).[2]
It is widely acknowledged that mitigation strategies are likely irrelevant over a mid-century horizon. Climatechange simulations for this timeframe provide a practical and near-term window for decision-making. Moreover, both the simulations used by the Intergovernmental Panel on Climate Change (IPCC) and projections of macroeconomic outcomes are considered more robust and reliable for mid-century scenarios. This is because they rely on shorter-term extrapolations, whereas 100-plus-year projections carry significant uncertainties regarding future climate dynamics and economic production systems. This highlights a common challenge for economists attempting to quantify long-term economic shocks. For most, 2040-50 feels like ‘tomorrow’, in contrast to the distant horizon of 2100. Looking backward, the technological disruptions of the 20th century make it implausible to assume that the 2100 economic system will resemble that of 2025. Similarly, the past three decades of rising global surface temperatures make it difficult to discuss climate impacts relative to a hypothetical baseline without climate change. Yet, due to scientific conventions and methodological constraints, this counterfactual baseline is often used to frame findings.
Our work indicates that mid-century scenarios already show substantial physical damages from climate shocks across many sectors (eg, calorie crop supply, energy demand for adaptation and associated infrastructures), with significant regional variations in impact. For instance, the tropics, due to their vulnerability to heat stress, crop failure and extreme weather events such as hurricanes and cyclones, are highly likely to face significant impacts by 2050. Low-lying coastal areas and small island nations are particularly exposed to rising sea levels, storm surges and coastal erosion threatening infrastructure, freshwater availability, and economic viability. Arid and semi-arid regions are projected to suffer from increased desertification, water scarcity, and reduced agricultural productivity due to prolonged droughts. Finally, high-latitude agricultural regions – and particularly the mid-western agricultural belt of the US – are predicted to experience substantial shifts in the planting and growing seasons. These changes are largely driven by higher atmospheric CO2 concentrations (CO2 ‘fertilisation’) forecast for mid-century (reaching >600 ppm according to the most severe warming scenario: a 53% increase from the historical baseline of 2010).
What does this tell us? For a long time, climate policy has focused primarily on mitigation targets, aiming to reduce fossil fuel combustion to avoid catastrophic end-century outcomes. However, the near certainty of extreme weather events and climate shocks at mid-century, regardless of the IPCC scenario, suggests that the time has come to put at least as much emphasis on adaptation.
As physical risks intensify by midcentury, maintaining economic productivity in exposed regions will require significant additional inputs, such as irrigation, fertilisers and mechanisation in the agriculture sector, or energy-intensive cooling systems in infrastructure. Much as economists often say that there are no ‘free lunches’, here we underline that one cannot assume ‘free adaptation capabilities’ either. The most immediate and unavoidable response is thus investment. But where should this investment go, and how much is required?
The adjustments needed to offset future productivity losses are not distributed homogeneously, even within clusters of physical infrastructures. Assets tied to economic output linked to regions and sectors most heavily exposed to midcentury risks will show increasing sensitivity to climate impacts. Additional analytics are needed to assess this sensitivity, evaluate how well it reflects localised risks, and determine whether there is a threshold where divestment, followed by reallocation to less vulnerable assets, becomes more cost effective.
Our research aims to address these critical questions for investors seeking to understand climate risks:
- What are the scales of future climate shocks at the local level, and how do these compare to global averages?
- In a warmer future, how much will it cost to produce the same output as today?
- Who will bear these costs, and what are the asset pricing implications of these adjustments, such as a potential climate premium?
Answering these questions is a core focus of our institute’s work.
Accounting for uncertainty: integrating climate uncertainty into decision-making
Uncertainty is often viewed as a limitation, but in climate research, it reflects how much remains to be understood – and how much potential there is for refining projections. The scientific community typically reports results for both severe (RCP8.5) and moderate (RCP4.5) warming scenarios. This approach provides two distinct medians of expected economic damages, which are sometimes complemented by an intermediate scenario. The duo can also be interpreted as forming a wide confidence band that includes the most likely climate outcomes falling somewhere between moderate and extreme warming.
In general, there is value in exploring both ‘central estimates’ and ‘tail events’. Neither, in isolation, tells the whole story. Ideally, we would like to have a full probability distribution for the various climate outcomes – and, indeed, our team is actively conducting innovative research in this direction. For now we have chosen to keep these two strands of investigation separate, allowing users to focus on one aspect at a time. When presenting extreme results, we align our assumptions on 2100 CO2 concentrations with Kotz et al (2024), who use the very well-established RCP8.5 carbon pathway. This ensures consistency and allows direct comparisons with Kotz’s findings, which have become a benchmark in the field and in public-policy applications. The likelihood of the RCP8.5 scenario is subject to heated debate. While Hausfather and Peters (2020) argue that RCP8.5 is an implausible worst-case scenario, Schwalm et al (2020) remark that, so far, it is the pathway that best empirically tracks historically realised emissions. Our parallel probabilistic analysis suggests that while RCP8.5 is not central, it is not a complete outlier either. There is therefore prudential value in taking it seriously.
As an answer to this intrinsic uncertainty, we build robust confidence intervals. For each administrative province, we simulate ~520 unique simulated impacts. This ensemble combines results from 30 global climate models (GCMs), two representative concentration pathways (RCPs) and nine future horizons. This granular approach enables us to account for investors’ preferences for specific GCMs or aversion to certain RCP scenarios, tailoring insights to diverse decision-making needs. Besides, our empirical calibration of historical responses tests for various specifications of the constant terms in our panel equation (see figure 2), enabling us to ensure that our temperature-GDP responses are empirically determined by both the data and parametric assumptions.
In the context of climate change, the high sensitivity of agricultural supply and energy demand to weather fluctuations, coupled with their pivotal role in the macroeconomic transmission of inflation, makes them crucial focal points of interest for regulators and investors. In the absence of extensive margin of adaptation (ie, expansion of cultivated lands), global crop producers located near the equator will most likely need to intensify the use of irrigation and fertilisers (ie, so-called intensive margins of adaptation) to compensate for temperature shift-driven land productivity declines expected locally. Will this suffice to offset most climatically induced profit losses? Probably not – as shown by recent work suggesting up to 12% global crop yield declines circa 2050 after accounting for producers’ local adaptation under a severe warming scenario (Wing et al [2021]). Other medium-run adaptation will include changes in crop varieties, different planting and harvesting dates, and changes in the degree of mechanisation. Geography remains a fixed statistic; cultivated lands are not mobile, unlike other production factors. This debate is often delayed, but its ultimate and unavoidable relevance lies in how to shift land usage of climate-resilient areas so that it balances out the significant losses expected in the most vulnerable climate zones (eg, the tropics). Answering this question requires large-scale processing of high-resolution climate and remotesensing data. The macroeconomic and trade effects from these micro-level adjustments to global climate shocks are also numerous but poorly understood, especially at intra-regional levels. To address this, one line of research involves integrating secular, country-averaged, land productivity shocks into a log-linear (Heckscher-Ohlin) model of global agricultural supply. Solving this program (using General Algebraic Modeling Language software) allows the implications for land supply and prices to be quantified.
From data to decisions: harnessing granularity for better risk management
Enhanced granularity of data can revolutionise our understanding of phenomena but requires computational challenges to be met. This cannot go without improving the performance of data wrangling methods and statistical models in large dimensional contexts. For instance, in our work on spatially distributed projections of climate-driven macroeconomic impacts, we processed terabyte-sized datasets containing 249,000 unique grid-cells, multiplied by 365 days, 30 GCMs, two RCPs – resulting in 5.4 billion rows per year of data.
Increased granularity reveals spatial patterns of past and future changes, but it necessitates high-memory nodes via remotely accessed super-computers. While this involves major entry cost, particularly human capital investment, the marginal cost of usage of some HPC platforms has experienced a significant decline.
This is the entry door to the production and supply of tailored composite visualisation products targeting single infrastructures, regions, counties and sub-sectoral components; and which can be directly taken up by end users. Combined with parametric insurance products, which set precise triggers in relation to localised risks and conditions such as regional weather patterns or natural disasters, high-granularity risk assessment can usher in better management of physical risk, from the ground up.
Footnotes
[1] See for instance: NCAR–USGS’s highly-resolved hourly 4km gridded surface weather for continental North America offering intra-day variability (Rasmussen et al [2023], https://www.usgs.gov/data/conus404-four-kilometerlong-term-regional-hydr... [1]); NASA DAYMET Project Version IV's 1km surface gridded daily downscaled meteorological fields (Thornton et al [2022], https://daymet.ornl.gov/ [2]); the Thermodynamics Global Warming Simulations Dataset containing hourly 12km x 12km data limited to the US extent (IM3/HyperFACETS from Srivastava et al [2023], https://tgw-data.msdlive.org/ [3]); and NASA’s Earth Exchange Global Daily Downscaled Projections (NEX-GDDP CMIP6) that bias-corrected and downscaled outputs from an ensemble of 30 distinct global climate models (GCMs) simulated under the Coupled Model Intercomparison, Phase VI (CMIP6, Eyring et al [2016]) exercise in time (to days) and space (to a 0.25° grid) globally (https://www.nccs.nasa.gov/services/ [4] data-collections/land-based-products/nex-gddp-cmip6).
[2] The availability of 30 global climate models (GCMs) simulated under the Coupled Model Intercomparison Project Phase 6 (CMIP6) exercise represents a golden opportunity to use the most complete time and spatially downscaled global warming simulations as part of our macroeconomic projection modelling. However, a subset of CMIP6 GCMs may be ‘too hot’, with representations of cloud feedback in some models associated with higherthan-consensus global surface temperature response to doubled atmospheric CO2 concentrations – equilibrium climate sensitivity (ECS) and global warming after 70 years of a 1% per annum increase in CO2 – transient climate response (TCR). To mitigate the threat of bias potentially introduced by this phenomenon, we follow the procedure recommended by Hausfather et al (2022) of excluding models with TCR and ECS outside ‘likely’ ranges (1.4-2.2°C, 66% likelihood, and 2.5-4°C, 90% likelihood, respectively). That leaves us with 15 ‘likely’ GCMs that form the basis of our macroeconomic projections.
References
- Bodirsky, B. L., S. Rolinski, A. Biewald, I. Weindl, A. Popp and H. Lotze-Campen (2015). Global Food Demand Scenarios for the 21st Century. PLOS One 10(11): e0139201.
- Burke, M., and K. Emerick (2016). Adaptation to Climate Change: Evidence from US Agriculture. American Economic Journal: Economic Policy 8(3): 106-140.
- Burke, M., S. M. Hsiang and E. Miguel (2015). Global NonLinear Effect of Temperature on Economic Production. Nature 527(7577): 235-239.
- Eyring, V., S. Bony, G. A. Meehl, C. A. Senior, B. Stevens, R. J. Stouffer and K. E. Taylor (2016). Overview of the Coupled Model Intercomparison Project Phase 6 (CMIP6) experimental design and organization. Geoscientific Model Development 9(5): 1937-1958.
- Hausfather, Z., K. Marvel, G. A. Schmidt, J. W. NielsenGammon and M. Zelinka (2022). Climate Simulations: Recognize the ‘Hot Model’ Problem. Nature 605(7908): 26-29.
- Hausfather, Z., and G. P. Peters (2020). RCP8.5 is a Problematic Scenario for Near-Term Emissions. Proceedings of the National Academy of Sciences 117(45): 27791-27792.
- Kotz, M., A. Levermann and L. Wenz (2024). The Economic Commitment of Climate Change. Nature 628(8008): 551- 557.
- Meinshausen, M., Z. R. Nicholls, J. Lewis, M. J. Gidden, E. Vogel, M. Freund and R. H. Wang (2020). The Shared SocioEconomic Pathway (SSP) Greenhouse Gas Concentrations and their Extensions to 2500. Geoscientific Model Development 13(8): 3571-3605.
- Mendelsohn, R. O., and E. Massetti (2017). The Use of Cross-Sectional Analysis to Measure Climate Impacts on Agriculture: Theory and Evidence. Review of Environmental Economics and Policy.
- Orlowsky, B., and S. I. Seneviratne (2012). Global Changes in Extreme Events: Regional and Seasonal Dimension. Climatic Change 110: 669-696.
- Rasmussen, R. M., F. Chen, C. H. Liu, K. Ikeda, A. Prein, J. Kim ... and G. MiguezMacho (2023). CONUS404: The NCAR– USGS 4-km long-term regional hydroclimate reanalysis over the CONUS. Bulletin of the American Meteorological Society 104(8): E1382-E1408.
- Schlenker, W., and M. J. Roberts (2009). Nonlinear Temperature Effects Indicate Severe Damages to US Crop Yields under Climate Change. Proceedings of the National Academy of Sciences 106(37): 15594-15598.
- Schwalm, C. R., S. Glendon and P. B. Duffy (2020). Reply to Hausfather and Peters: RCP8.5 is neither Problematic nor Misleading. Proceedings of the National Academy of Sciences 117(45): 27793-27794.
- Srivastava, A. K., P. A. Ullrich, D. Rastogi, P. Vahmani, A. Jones and R. Grotjahn (2023). Assessment of WRF (v 4.2. 1) dynamically downscaled precipitation on subdaily and daily timescales over CONUS. EGUsphere 2023: 1-32.
- Thornton, M. M., R. Shrestha, Y. Wei, P. E. Thornton, S. Kao and B. E. Wilson (2022). Daymet: Monthly Climate Summaries on a 1-km Grid for North America, Version 4 R1. ORNL DAAC, Oak Ridge, Tennessee, US.
- Wing, I. S., E. De Cian and M. N. Mistry (2021). Global Vulnerability of Crop Yields to Climate Change. Journal of Environmental Economics and Management 109: 102462