
A case study in real assets investing: the French non-listed real estate fund market
by Shahyar Safaee, Research Engineer, EDHEC-Risk Institute

In the January issue of our EDHEC-Risk Institute newsletter, Professor Rebonato reminded us of the risk of inflation created by the quantitative easing policies of leading Western central banks, thus highlighting the relative benefits of holding real assets if such a risk were to materialise. The question an investor may ask as a result is: “how do I efficiently build exposure to real assets in my overall portfolio?” A comprehensive answer is obviously beyond the scope of this newsletter, but recent research conducted by EDHEC-Risk Institute on the growing French non-listed real estate fund market may serve as a timely case study that we hope will be food for thought for investors, and perhaps spur similar analyses in other real estate markets.
Real estate has become an essential part of institutional investment portfolios and is now established as a source of diversification and added value in the context of multi-class portfolio construction. However, achieving efficient real estate exposure in practice has often been a challenge because of the main distinctive/idiosyncratic features of the asset class: no liquid market exists for an individual real estate asset, property management is a large contributor to performance, and specific risk is a large contributor to overall risk. Finally, diversification (geographic or by property type) can be challenging for it can hinder economies of scale in property management.
As a result, a variety of real estate investment vehicles have been designed over time to solve some or all of the challenges typical of direct investing. They fall into three groups: (1) private entities (e.g. private equity-like funds), (2) exchange-traded vehicles (e.g. REITs) and (3) publicly registered non-listed funds. The latter group aims to follow a “Third Way” by striking a balance between liquidity (provided by group (2) but not by group (1)) and decorrelation from traditional asset classes (provided by group (1) but often lacking in group (2)), in order to offer investors the best of both worlds. Public non-listed funds do indeed provide some liquidity, albeit less than REITs, and display lower volatility and lower correlation with equity markets by offering a risk-and-return profile reflective of the underlying real estate physical assets. Examples of public non-listed funds include the non-traded perpetual-life REIT in the US (also called NAV REIT; the largest NAV REIT is currently the Blackstone Real Estate Income Trust, with $23bn of AUM), its counterpart in France known as Société Civile de Placement Immobilier (SCPI), the non-listed closed-end and open-end property funds in the UK, or the German open-end real estate fund (although the latter can, interestingly, also be traded on stock exchanges).
In a recent paper produced as part of the Swiss Life Asset Managers France “Real Estate in Modern Investment Solutions” research chair at EDHEC-Risk Institute (see Guedj, Martellini and Safaee (2021) for more details), we analyse whether traditional investment management techniques such as fund selection and portfolio allocation can be applied to the SCPI fund universe and create value for investors. Our analysis focuses specifically on SCPIs with the longest track record, invested in commercial real estate.
The SCPI vehicle and market
The purpose of a commercial SCPI is to own and manage real estate assets in order to generate a rental income that gets distributed to investors in the form of a dividend (generally paid quarterly). It is a regulated investment vehicle supervised by the Autorité des Marchés Financiers (AMF) and equipped with the high level of governance required to attract retail investors.
The commercial SCPI market experienced annual double-digit growth (mostly driven by capital inflows) between 2009 and 2020, with AUM almost quadrupling in local currency terms to reach EUR 67bn by the end of 2020 (the Covid-19 crisis slowed down the 2020 AUM annual growth, which was around +10%). Strategy-wise, commercial SCPIs may focus on different classes of commercial real estate assets, with the two most common categories being office and retail (representing more than 85% of the exposure in SCPI portfolios). In terms of capital type, SCPI vehicles may be structured as open-end or closed-end property funds. The market was historically dominated by closed-end funds, but gradually shifted to the open-end capital type, now representing 75% of the vehicles and 91% of the AUM, in order to accommodate the large capital inflows.
SCPI Performance and risk analysis
We define the continuously compounded price return, total return and dividend yield of an SCPI (or a portfolio/index of SCPIs) respectively as
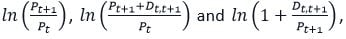
where
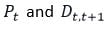
are respectively the reported subscription price at time t and the gross dividend amount paid between 
Our analysis of the time-series performance of SCPIs shows some stability in absolute dividend distributions 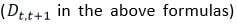 over long-term horizons, which effectively makes the dividend yield akin to an inverse function of price and a proxy for the property capitalisation rate.
Figure 1 below represents the price-return performance and the dividend yield of the EDHEC IEIF Commercial Property (France) Index (see EDHEC (2009)) from 1981 to 2019 and shows a long-term trend of dividend yield compression since 1981 (mirroring an upward trend in the price-return index) with an interruption during the European real estate crisis of the 1990s. We note that over 75% of the index’s total return throughout the period is explained by dividend distribution, which is consistent with the purpose of SCPIs as rental income-generating vehicles.
Figure 1 – Price-return value and dividend yield of the EDHEC IEIF Commercial Property (France) Index
This figure displays the evolution between 1981 and 2019 of the price-return index value (solid blue line, lhs axis) rebased at 100 in 1981, and of the annual dividend yield of the index (solid red line, rhs axis) where the initial annual dividend yield in the figure is by convention computed between ]1980, 1981].
We also performed a cross-sectional analysis using a dataset kindly provided by the Institut de l’Epargne Immobilière et Foncière (IEIF), the leading independent research organisation covering the French real estate investment market. Our panel of commercial SCPIs includes 53 vehicles with reported performance data from 2003 to 2019. The results are summarised in Figure 2 below, representing the 2003–2019 average total return, average price return and average dividend yield for each SCPI, ranked by increasing total return (from left to right).
Figure 2 – Cross-section of total return, price return and dividend yield
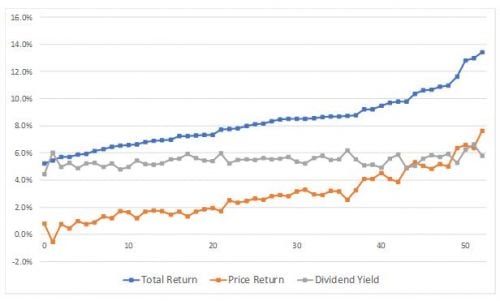
This figure reports, for each of the 53 SCPIs in our dataset, the 2003–2019 average annual total return (solid blue line), average annual price return (solid orange line) and average annual dividend yield (solid grey line).
The SCPIs are sorted by increasing average annual total return from left to right. For each SCPI, the total return (in blue) is equal to the sum of the price return (in orange) and the dividend yield (in grey).
The cross-sectional stability of the dividend yield (in grey) is striking; it appears that differences in total return (in blue) are almost entirely explained by differences in price return (in orange). Put another way, despite being the largest contributor to total return (as per the time-series analysis), the dividend yield plays little part in differentiating across SCPIs’ performances. For instance, the marginal contributions to (cross-sectional) volatility[1] of total return are respectively equal to 89% and 11% for price return and dividend yield.
Analysing the time-series volatility of SCPIs’ returns requires an understanding of (1) their valuation mechanism and (2) the procedures governing their primary and secondary markets, both of which differ between closed-end and open-end SCPIs. In a nutshell, the valuation of the latter is appraisal-based while that of the former is market transaction-based. Consequently, we find the need to adjust the performance data of open-end SCPIs for biases related to smoothing effects (see Geltner (1993)) and possible lack of liquidity. Our statistical corrections also account for occasional staleness (i.e. infrequent data) and eventually allow us to produce enhanced estimates of historical volatilities and correlations of SCPI returns (see Guedj, Martellini and Safaee (2021) for more details). The cross-section of SCPI time-series volatilities is consistent with the outcome of our performance analysis: the cross-sectional distribution of SCPI total return time-series volatilities shows a substantial amount of dispersion which is primarily explained by the large dispersion in price return time-series volatilities.
The large dispersion observed in performance and in risk naturally supports the idea that investors would benefit from the implementation of selection and allocation processes. It is also comforting to note that such statistical dispersion can be qualitatively reconciled with the evolution of the sector and the fact that over time SCPIs have been pursuing a wider range of investment strategies, whether it be new real estate asset categories, innovative income models, geographic diversification (e.g. European real estate) or the use of leverage.
Portfolio diversification and benefits of allocation
Based on the above results on performance and risk, we would expect a well-diversified portfolio of SCPIs to substantially outperform individual SCPIs from a risk-adjusted return standpoint. The equally-weighted (EW) portfolio of the 53 SCPIs in our panel is a natural candidate to examine. We observe that its 2003–2019 average total return (equal to the cross-sectional average of the 53 total returns) is in line with the “average SCPI” in the panel and dominates approximately 51% of the population. Its 2003–2019 time-series volatility is, on the other hand, significantly lower than that of the “average SCPI” thanks to the risk-reducing effect of diversification: the EW portfolio is less risky than most (88%) of the SCPI panel. This eventually translates into a superior risk-adjusted total return for the EW portfolio: its ex-post Sharpe ratio dominates 92% of the population. As part of our study we also tested other portfolio weighting schemes such as a capitalisation-weighted portfolio, a global minimum variance portfolio and an equal risk contributions portfolio and found substantial diversification benefits in all cases, supporting evidence of the benefits of allocation decisions when investing in SCPIs.
Although the practical implementation of an allocation process is outside the scope of our article, we nevertheless recognize there are possible limits to the benefits of diversification in the presence of market frictions. In particular, the somewhat limited liquidity of SCPIs means that diversification is not strictly cost-free. When accounting for an SCPI’s subscription fees and with finite secondary market volumes, the benefit of diversification may in some circumstances be more than offset by the cost of implementing such diversification. We have therefore analysed the risk reduction created in an EW portfolio as a function of the number of SCPIs included in the portfolio. Figure 3 represents the 2003–2019 time-series volatility of an “average” EW portfolio as we vary the number of constituents from 1 to 53. Each point on the curve is calculated as the average volatility across 2,000 randomly constructed EW portfolios of N constituents (N = 1,…, 53).
Figure 3 – Total return volatility of the equally-weighted “average SCPI portfolio” as a function of the number of SCPIs in the portfolio
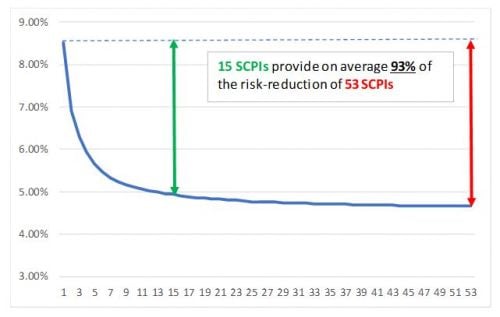
This figure displays the expected 2003–2019 annual total return volatility (solid blue line) of a randomly constructed equally-weighted portfolio of k SCPIs as a function of k = 1,…,53.
For each value of k, the expected volatility is obtained by computing the mean of the 2003–2019 annual total return volatilities across 2,000 random portfolios of size k.
We observe that the marginal benefit of diversification is quite strong for low values of N, and gradually lessens as N approaches 53. Based on our estimates of volatilities and correlations, we find that 93% of the full risk reduction is obtained after only 15 SCPIs. This is a promising result that should help SCPI investors optimise the implementation of their allocation process (which will need to account for market frictions). It also creates a strong motivation, along with the large dispersion in risk and return, to explore the benefits of selection decisions. Put another way, if 15 SCPIs are enough to build a diversified portfolio, which ones should we pick?
Relevant candidate attributes for SCPI selection
Our aim here is not an exhaustive search of value-adding selection attributes, including attributes inferred or constructed from SCPIs’ financial statements, nor the rigorous design of an SCPI selection process as these would at the very least require an in-depth out-of-sample analysis. Our ambition is simply to provide support for such an initiative by testing a few observable attributes and examining their ability to enhance the in-sample risk-adjusted return profile of an SCPI portfolio.
Our analysis covers eight SCPI attributes (see Guedj, Martellini and Safaee (2021) for more details), each leading to two or more mutually exclusive and collectively exhaustive groups of SCPIs, that we view as possible candidates for inclusion in a selection process.
The most promising results were obtained for the Fund Size attribute (ranking SCPIs by AUM), the Volatility attribute (ranking SCPIs by time-series volatility), as well as the Past Performance attribute (distinguishing past winners from past losers). The Fund Size attribute does indeed show some explanatory power with respect to risk and return, with smaller funds reporting on average a higher level of total return performance and a higher level of volatility than their larger-sized peers (see results in Figure 4).
Figure 4 – Average total return and average volatility of the four groups related to the Fund Size attribute
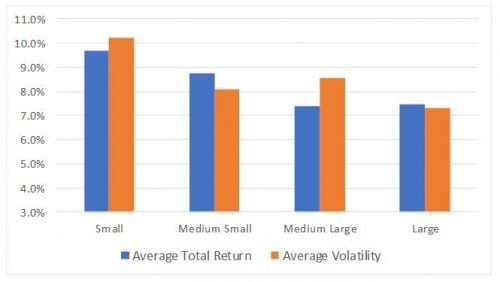
This figure reports, for each group constructed based on the Fund Size attribute, the cross-sectional average (across all SCPIs comprising the group) of the 2003–2019 average annual total returns (blue bars), and the cross-sectional average of the 2003–2019 annual total return volatilities.
The impact and relevance of the Fund Size attribute has been documented in the real estate academic literature although the sign of the impact varies (see Fuerst and Matysiak (2013) for an outperformance of larger funds, and Guidolin and Pedio (2019) for an outperformance of smaller funds). Turning to the Volatility attribute, we observe that the average level of total return performance reported by ‘Low Vol’ SCPIs is not significantly different from their higher volatility peers in the other groups (with the exception of the ‘High Vol’ group which seems to be a proxy for the ‘Small’ group of the Fund Size attribute). ‘Low Vol’ SCPIs therefore dominate the panel from a risk-adjusted return standpoint. This might be an instance of a low volatility anomaly (well-known to equity investors) although rigorous out-of-sample testing will be required before formally including the Volatility attribute in a selection process. Finally, we observe some modest level of persistence in performance, i.e. past winners (respectively past losers) tend to outperform (respectively underperform) in subsequent periods. This is akin to a “momentum” effect that is pervasive in equity markets and has also been documented in the real estate literature (see Stevenson (2002) and Guidolin and Pedio (2019)). Further research will be required to assess the robustness (particularly out-of-sample) of the attributes we have highlighted, but our results suggest that investor welfare can be enhanced via suitable SCPI selection decisions.
Conclusions
The commercial SCPI market offers a significant amount of dispersion in risk and return characteristics, and portfolios of SCPIs exhibit a substantially lower level of volatility than the “average SCPI” in the panel. Additionally, we find several attributes to have relatively strong explanatory power with respect to such differences in risk and performance. Both results suggest that value can be added by selection and allocation decisions, which could form the basis of a welfare-enhancing open architecture multi-management approach to investment in SCPIs.
Our work could be extended in several directions. The inclusion of financial analysis data (sourced from SCPI’s financial statements and management reports) seems like the natural step forward to design a robust selection process. Additionally, the identification and/or construction of relevant risk factors will guide investors in their search for material (and low-cost) diversification benefits. Finally, a full-blown multi-management methodology would lay the groundwork for the inclusion of SCPI portfolios as part of the performance-seeking and/or liability-hedging portfolios of innovative liability-driven or goal-based investing solutions.
Footnote:
[1] For an introduction to “marginal contribution to risk” see for example Menchero and Davis (2011), Risk Contribution Is Exposure Times Volatility Times Correlation: Decomposing Risk Using the X-Sigma-Rho Formula. Journal of Portfolio Management 37(2) 97–106.
References
EDHEC (2009). Real Estate Indexing and the EDHEC IEIF Commercial Property (France) Index. EDHEC-Risk Institute Publication
Fuerst, F. and G. Matysiak (2013). Analysing the Performance of Non-Listed Real Estate Funds: a Panel Data Analysis. Applied Economics 45(14), 1777–1788
Geltner, D. (1993). Estimating Market Values from Appraised Values without Assuming an Efficient Market. Journal of Real Estate Research 8(3), 325–345
Guedj B., L. Martellini and S. Safaee (2021). Benefits of selection and allocation decisions in the French non-listed real estate investment fund market. EDHEC-Risk Institute Publication
Guidolin, M. and M. Pedio (2019). How Smart is the Real Estate Smart Beta? Evidence from Optimal Style Factor Strategies for REITs. BAFFI CAREFIN Centre (Bocconi) Research Paper No. 2019–117
Schoeffler, P. (2020). Liquidity of real estate funds available to the general public in France. Institut de l’épargne immobilière et foncière (IEIF)
Seiler, M.J., J.R. Webb and F.C. Neil Myer (1999). Diversification Issues in Real Estate Investment. Journal of Real Estate Literature 7(2), 163–179
Stevenson, S. (2002). Momentum Effects and Mean Reversion in Real Estate Securities. Journal of Real Estate Research 23(1/2), 47–64
About EDHEC
Operating from campuses in Lille, Nice, Paris, London and Singapore, EDHEC is one of the world’s top 15 business schools. Fully international and directly connected to the business world, EDHEC commands a strong reputation for research excellence and the ability to train entrepreneurs and managers capable of breaking new ground. EDHEC functions as a genuine laboratory of ideas and produces innovative solutions valued by businesses. The School’s teaching is inspired by its research work and a focus on “learning by doing”, all with the aim of equipping people with the skills to succeed in business.
