
Chasing the environmental factor
By Emanuele Chini, Former Research Engineer, EDHEC-Risk Climate Impact Institute
- The paper analyses whether US stock excess returns are pricing in exposure to a climate/ environmental risk factor. We try to answer this question through a latent facto model: indeed, the climate factor is estimated by starting from a large panel of US stock excess returns and a large set of firm-specific environmental related characteristics (e.g., emissions and environmental scores).
- This environmental factor that we estimate can be interpreted (ex-post) as an emissions factor and it is only relevant to explaining the returns of stocks within the Oil and Utilities sectors.
- Surprisingly, stocks of companies within other high-emitting sectors as Chemicals and Steel, among others, are not affected by this factor.
Introduction
Climate-aware investment management is still in its infancy but is growing fast. As documented by Krueger, Sautner and Starks (2020) and Strobel and Wurgler (2021), investors are paying more and more attention to climate and environmental matters. Consequently, their demand for means to assess their portfolio’s exposure against these new types of risks is also increasing. Following this trend, data and analytics providers specialising in climate and environmental scores have proliferated. However, ESG metrics diverge across providers (see among others Berg, Kolbel and Rigobon, 2022), and environmental metrics, at least beyond Scope 1+2 greenhouse gas emissions estimates (Busch, Johnson and Pioch, 2020), are also divergent.
Furthermore, it is not yet clear if companies with low environmental footprint should earn lower or higher returns. Indeed, despite the rapidly increasing number of academic studies trying to assess the impact of climate risks on equities, the “sign” of the effect is still not clear, and the reported results are sometimes in conflict with one another. Indeed, different definitions of “green” give rise to different results. Bolton and Kacperczyk (2021, 2022), Hsu, Li and Tsou (2022), and Alessi, Ossola and Panzica (2021), among others, find that high polluting companies earn higher returns because they are exposed to regulatory risk (e.g., a carbon tax). On the other hand, Pastor, Stambaugh and Taylor (2022), In, Park and Monk (2019), and Cheema-Fox et al. (2021) find that companies with a good environmental score, outperform “brown” companies because of the recent shift in investor preferences for green assets. This preference shift is the cause of abnormal returns, and in the future, green companies are not expected to persistently outperform their brown peers.
In this work we contribute to the climate finance literature by assessing whether ESG and environmental (which we hereafter refer to as environmental) characteristics of companies line up with excess stock returns. Instead of defining a greenness measure and then assessing whether it is related to a risk premium, we use a conditional latent factor model: the instrumented principal component analysis model (hereafter IPCA) developed by Kelly, Pruitt and Su (2019), which we extend to deal with financial and non-financial characteristics separately.
The Model
In their seminal work, Kelly, Pruitt and Su (2019) develop the IPCA model to extract a small number of latent factors (and their betas) starting from a panel of equity excess returnsand a large set of observable company-level characteristics which are, indeed, the instruments used to infer the betas.
The general IPCA specification for the excess return  on the i-th asset of the
  assets observed at time
  and described by K latent factors
  is:
is:
where the dynamic factor betas  and alpha
  are inferred from the L-dimensional vector
  that contains the i-th asset’s observable characteristics valued at time t (and a constant):
The L x K matrix  and the L-dimensional vector
  are the (constant-in-time and constant-across-assets) parameters that map characteristics into betas and alphas, respectively, and by their inspection one can understand the “identity” of the estimated latent factors. It is worth saying that to properly compare the different values in and , we need to standardise the characteristics by computing, for each date, the respective cross-sectional ranks and normalising them (to the [-0.5, 0.5] interval). From equation (2) is clear that the values of an asset’s betas and alpha change when the asset characteristics change. Nevertheless, the inclusion of
  indicates that alphas and factor loadings may not be perfectly determined by the observable instruments. It is also important to note that by indexing characteristics with time t and returns with , IPCA aims to extract predictive power for future returns from prevailing observable information available at the forecast time.
To fully understand the innovative contribution of this methodology to the asset pricing literature, it is worth mentioning that characteristics are often used to proxy companies’ exposure to risk factors, such as size and book-to-market in Fama and French (1993)’s three factor model. Typically, we can build the mimicking portfolio of the risk factor associated to a specific characteristic, say, size, by sorting companies by size into quantiles and then using the extreme quantiles for the long and short legs of the portfolio. For instance, stocks with size ratings above the 70th percentile (below the 30th percentile) could be chosen as constituents of the short (long) leg of the mimicking portfolio. In this way, any observable characteristics can be used to build a factor. The consequence is the “factor zoo” documented by Harvey and Liu (2020): over 400 factors have been published in top academic financial journals, and this number is definitely unrealistic. The main idea under the IPCA model is that if there are many characteristics which are potentially informative of returns, we can reduce the dimensionality of the factors (built as long-short portfolio on characteristics) by computing the first k principal components of these factors, where k is arbitrary chosen, but it has to be far smaller than the number of characteristics.[1] This dimension reduction allows us to concentrate the useful information contained in a large number of characteristics in few factors.
In their work, Kelly, Pruitt and Su (2019) use 36 financial characteristics (such as market capitalisation, total assets, book-to-market, etc.) to extract five factors and show how their model explains the cross section of equity returns more accurately than existing factor models.
In this work, we extend the original IPCA model to allow for two separate groups of characteristics and constrain each of the IPCA factors to depend on only one of the two groups. We integrate the characteristics used by Kelly, Pruitt and Su (2019) with an additional set of environmental characteristics and ESG scores (described in the next section) to extract five financial factors and one environmental factor. Therefore, starting from a panel of equity excess returns and two sets of observable company-level characteristics that we observe for each company (namely, financial characteristics and environmental characteristics), we can extract two groups of factors. The first group of factors depends only on financial characteristics, and the second group only on environmental characteristics. This innovation enables us to clearly interpret the estimated factors as either purely financial or purely environmental.
Data
To perform our analysis, we need to collect financial and environmental characteristics, and the returns. We focus on US stocks in the period July 2008 – December 2021.
Among the financial characteristics used in Kelly, Palhares and Pruitt (2021), we select those whose contribution to the model was found to be statistically significant. We retrieve values for them from the Global Factor Data open-source dataset by Jensen, Kelly and Pedersen (2022). The financial characteristics that we observe for all the companies in our sample for at least one period are: total assets, book to market, market beta, earning to price, free cash flow, idiosyncratic volatility, investment, size, share turnover, leverage, profit margin, ROE, bid ask spread, closeness to 52-week high, momentum, long term reversal, short term reversal, and a characteristic which is constant over time and among stocks. It captures the systemic risk common amongst all the stocks.
The environmental characteristics that we use are either from the MSCI ESG IVA dataset or Eikon. We use ESG scores, “E” scores, emissions scores both from MSCI and Eikon; carbon intensity and carbon emissions from Eikon; and the environmental score weight from MSCI which is intended to measure the salience of environmental risks for firms. Since emissions, carbon intensity and the weight of the environmental score highly depend on sectors, we decompose each of these three characteristics in a sectoral component and an idiosyncratic component. As we observe that the three sectoral components are highly correlated, we keep only the sectoral carbon intensity in order to avoid multicollinearity. (For robustness check, we perform the analysis substituting sectoral carbon emissions for sectoral carbon intensity as well, and the results do not change.)
To make sure that environmental and ESG characteristics are not informative of returns only because they are correlated with company fundamentals, we orthogonalise environmental characteristics with respect to financial characteristics at each date, by running for each environmental characteristics a cross sectional regression on the financial characteristics. It is worth noting that one could orthogonalise financial characteristics, with respect to environmental characteristics, without loss of generality. However, since we are interested in understanding whether an environmental risk factor exists on top of standard factors, we decided to orthogonalise environmental characteristics with respect to financial characteristics by regressing each environmental characteristics on the financial characteristics. These are cross sectional regressions and are performed at each time.
Empirical Analysis
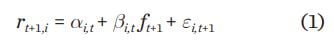
Now, turning to our empirical results, figure 1 displays the cumulative returns of our environmental factor.
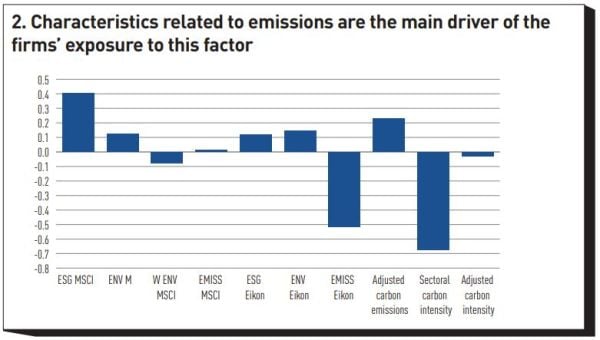
To understand better the “identity” of this environmental factor, it is worth recalling that it is (almost) the first principal component extracted by long/short portfolios built on the environmental characteristics. The “weights” of these portfolios in forming the first principal component (that is our environmental factor), are informative of which environmental characteristics determine the companies’ exposure to the factor. Figure 2 shows that characteristics related to emissions are the main driver of the firms’ exposure to this factor. In fact, sectoral carbon intensity, adjusted carbon emissions and both Eikon’s and MSCI’s emission scores are the first four characteristics in absolute value. Eikon’s emission score is a rating given by Eikon that assesses the commitment of the company to reducing its emissions, and it is normalised across industries. Similarly, MSCI’s emission score is also informative of a company’s commitment in reducing its emissions but it is not normalised across industries.
We now assess the explanatory power of our IPCA model for stock returns. Figure 3 displays in-sample R²s. The in-sample analysis is performed by estimating the model parameters only once using the full dataset. Then in order to track the marginal contribution of the different model components in explaining returns, in figure 3 we show values of the R²s computed by using different subsets of our estimated factors and/or alphas, namely:
- only first k financial systematic risk factors (k-th column with k = 1,..5),
- the financial systematic risk factors and financial component of alpha (column 6), the financial systematic risk factors and the entire alpha (column 7), and
- all components of the model specified, (column 8).
It is worth specifying that we estimate the full model only once, therefore the different columns of figure 3 enable us to compare directly the incremental informational content of the different building blocks of our model. Comparing the last two columns in Table 1, row “All sectors”, we observe that stock returns are remarkably well described by systematic financial factors, leaving little room for a common undiversifiable risk factor with an environmental connotation. In fact, the R² increment due to the environmental factor is extremely limited (+0.43%). It is worth saying that an easy way to increase this figure would be to orthogonalise financial characteristics with respect to environmental characteristics and therefore to cluster information that is common among the two set of characteristics in the environmental factor. However, this does not increase the overall performance of the model.
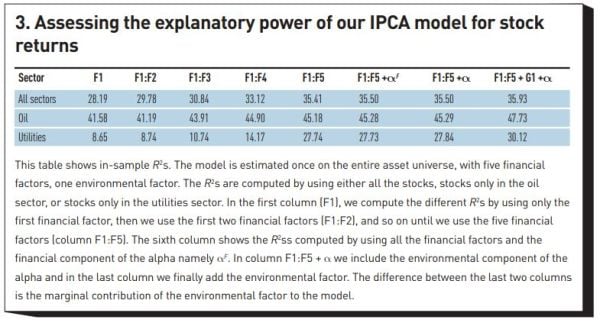
However, since environmental characteristics may be particularly relevant only for some industries, we group stocks according to their sectors (we use Fama-French 30 sectors' definitions). Then, for each group, we assess how the IPCA environmental factor explains returns of stocks in that sector by measuring the R². In the last two rows of figure 3, we show the performance measures for only the sectors that are affected by the environmental factor: Oil and Utilities. The Utilities sector's increases from 27.84% to 30.12%, stocks in the Oil sector are similarly affected by the environmental factor: their R² increases from 45.29% to 47.73%.
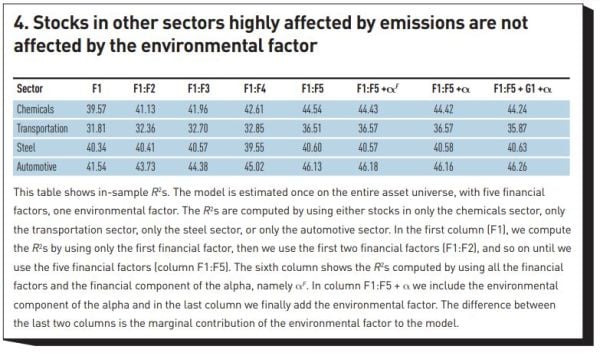
Importantly, other sectors that are highly affected by emissions (either directly or indirectly), namely Transportation, Automotive, Chemicals, and Steel, are on average not affected by the environmental factor, and do not seem to price an environmental risk at all (figure 4). Exploring the causes (and consequences) of different (and little) climate risk exposure for different sectors constitutes an interesting avenue for future research.
Conclusions
We study to what extent environmental firm-characteristics affect equity returns. This is particularly relevant for investors, since ESG and climate-aware investing has gained traction quickly, but it is not yet clear whether or how environmental measures affect returns. To answer this question, we use an innovative methodology that allows us to control for a rich set of information potentially useful to explain returns. With our methodology, we extract an environmental factor and find that companies’ betas to this factor are mainly driven by sectoral carbon intensity and Eikon’s emissions scores. Sectoral carbon intensity is the average carbon intensity (Scope 1 and Scope 2 emissions normalised by revenues) of companies operating in the same sector. On the other hand, Eikon’s emissions score is a metric that is sectorial neutral and that measures the effort of a company in reducing its emissions compared to its peers. We find that this factor is important for the in-sample pricing of stocks only in the Oil and Utilities sectors, above and beyond financial factors (which suffice to explain the cross section of stock returns of the companies in the other sectors). However, the environmental factor’s contribution to explaining returns is quite modest.
Emissions-related characteristics are the main drivers of the environmental factor, and this factor matters only for companies operating in either the Oil or Utilities sectors, which is not a surprise as these two sectors are among the most polluting. What is more surprising is that stocks within other high-emitting sectors are not affected by our environmental factor.
It is difficult to understand why this is the case. Unless damages are expected to materialise so far into the future that they become negligible after discounting, we would expect asset prices to be strongly affected by climate risk: either because we do little and are hit by the full consequences of 3+ degrees of warming, namely physical risk; or because we do a lot, and we have to rewire the whole economy, namely transition risk. This suggests that prices sooner or later will have to adjust: expected cashflows and earnings ultimately turn into realised cashflows and earnings. Having said that, we do not have a clear view about why high-emitting sectors are affected by our environmental factor differently. Analysing the reasons (and the consequences) of these differences would be an interesting avenue for further research.
Footnote
[1] This is a simplified version of the model, however, the intuition of IPCA is the same.
References
Alessi, L., E. Ossola and R. Panzica (2021). What greenium matters in the stock market? The role of greenhouse gas emissions and environmental disclosures, Journal of Financial Stability, 54, p. 100869.
Berg F., J.F. Kolbel and R. Rigobon (2022). Aggregate Confusion: The Divergence of ESG Ratings, Review of Finance, 26, 1315–1344.
Bolton, P., and M. T. Kacperczyk (2021). Do Investors Care about Carbon Risk? Journal of Financial Economics, 142, 517-549.
Bolton, P., and M. T. Kacperczyk (2022). Global Pricing of Carbon-Transition Risk. Journal of Finance, (forthcoming).
Busch T., M. Johnson and T. Pioch (2020). Corporare carbon performance data: Quo vadis? Journal of Industrial Ecology, 6, 350-363.
Cheema-Fox, A., B.R. Laperla, G. Serafeim, D. Turkington and H. Wang (2021). Decarbonization Factors. The Journal of Impact and ESG Investing. 2, 47-73.
Fama E.F., and K.R. French (1993). Common risk factors in the returns on stocks and bonds. Journal of Financial Economics, 33, 3-56.
Harvey, C.R., and Y. Liu (2020). A census of the factor zoo. Working paper.
Hsu, P.-H., K. Li and C.-Y. Tsou (2022). The Pollution Premium. Journal of Finance.
In, S., K.Y. Park and A.H.B. Monk (2019). Is ’Being Green’ Rewarded in the Market? An Empirical Investigation of Decarbonization and Stock Returns. Working Paper.
Jensen, T.I., B.T. Kelly and L.H. Pedersen (2022). Is There A Replication Crisis In Finance? Journal of Finance, (forthcoming).
Kelly, B.T., D. Palhares, and S. Pruitt (2021). Modeling Corporate Bond Returns. Journal of Finance, (forthcoming).
Kelly, B.T., S. Pruitt and Y. Su (2019). Characteristics are covariances: A unified model of risk and return. Journal of Financial Economics, 134, 501-524.
Krueger P., Z. Sautner and L.T. Starks (2020). The Importance of Climate Risks for Institutional Investors. The Review of Financial Studies, 33, 1067-1111.
Pastor, L., R.F. Stambaugh and L.A. Taylor (2022). Dissecting Green Returns. Journal of Financial Economics, 142, 403-424.
Stroebel, J., and J. Wurgler (2021). What Do You Think about Climate Finance?Journal of Financial Economics, 142, 487-498.
Rubrique
About EDHEC
Operating from campuses in Lille, Nice, Paris, London and Singapore, EDHEC is one of the world’s top 15 business schools. Fully international and directly connected to the business world, EDHEC commands a strong reputation for research excellence and the ability to train entrepreneurs and managers capable of breaking new ground. EDHEC functions as a genuine laboratory of ideas and produces innovative solutions valued by businesses. The School’s teaching is inspired by its research work and a focus on “learning by doing”, all with the aim of equipping people with the skills to succeed in business.
