
Dealing with Climate Change: Asset Pricing Implications of Monetary and Fiscal Choices
By Riccardo Rebonato, Scientific Director, EDHEC-Risk Climate Impact Institute; Professor of Finance, EDHEC Business School
- To fully decarbonize the economy by mid-century abatement initiatives are required for which unsubsidized private intervention is less likely to provide financing than has been the case so far.
- Public involvement will have to take the form of higher taxation or higher debt. In the present condition of unprecedentedly high public debt, and of reluctance to accept higher taxation, this creates a problem.
- If the second phase of the green transition is mainly financed by debt, the global debt burden could rise by as much as 40%, putting pressure on interest rates. This would have direct repercussions on the price of government bonds, and an indirect effect on equity valuation via the discounting channel.
1 – Setting the Scene
In a recent article in The Journal of Finance, Bolton and Kacperczyk (2023) have provided an analysis of the impact of climate transition risk on the pricing of global asset. Their excellent analysis is based on a key methodological assumption, ie, that by mid-century the decarbonization of the economy will be achieved. Given this hard decarbonization deadline, those companies or sectors that are currently delaying their transition towards decarbonization will face a greater adjustment (‘transition’) risk, exactly because the 2050 deadline is assumed to be ‘hard’.
Given the assumption, the analysis is logically impeccable. In this piece I intend to argue that investors should not take for granted that the 2050 decarbonization goals will certainly be met. More precisely, I intend to explain that in the years to come financing the green transition will become increasingly difficult and politically painful. I will also argue that, if the decarbonization targets are to be met, this will involve a much higher degree of publicly funded investment than it has been the case so far. If, conversely, this public funding is not forthcoming, then temperature increases are likely to be much higher than currently hoped for, and physical damages will become more important (the analysis of Bolton and Kacperczyk (2023), by the way, concludes that the physical climate risk is currently not priced, a conclusion with which we concur – see Rebonato (2023) in this respect). I intend to show in this piece that, in either case, the prices of assets will be significantly affected.
Key to my argument is the magnitude and source of the financing required to achieve the decarbonization of the economy. Let me start with the size first. The estimates vary greatly, but the UN Intergovernmental Panel on Climate Change estimates that the financial investment necessary to meet the 1.5°C target should be between $1.6 trillion and $3.8 trillion per annum between 2020 and 2050 just for the transformation of the energy systems alone.[1] Let's take the average and add the estimated costs for adaptation (about $200 billion per annum), and we reach a total of about $3 trillion per annum. Along similar lines, the consultancy McKinsey[2] estimates that to meet the 1.5°C target `[c]apital spending on physical assets for energy and land-use systems will need to rise by $3.5 trillion per year for the next 30 years, to an annual total of $9.2 trillion per year for the next 30 years’. To gauge how big these figures really are, one should remember that they are more than the world spends on military ($2 trillion); more than what it spends on education ($3.2 trillion); and about the same as the biggest spend item of them all, healthcare ($8.3 trillion).
This huge financing needs can be provided in three ways: by private investment; by some form of taxation (generalized ‘carbon taxes’); or by public debt. I intend to argue that the contribution from the private sector is going to be smaller for the phase of the decarbonization process that we are entering. If a near-complete decarbonization of the economy by 2050 is to be achieved, this will have significant either debt or fiscal implications. In turn, these dynamics will affect asset prices – directly, as far as fixed-income assets are concerned; and via the discounting channel for equity assets. If, on the other hand, the financing is not forthcoming, we can expect significant climate damages, probably greater than the market is currently impounding. So, either via a transition-risk or a physical-risk channel, we can expect prices to be affected by how we handle the green transition. The rest of the paper makes this intuition more precise.
2 – The End of Easy Climate Financing
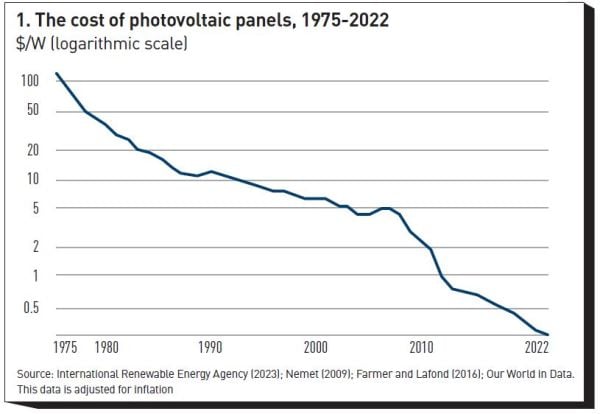
Despite a pace of decarbonization which to date has been not nearly fast enough to keep us within the Paris-Agreement 1.5-2°C target, there have been some notable successes in the abatement chronicles. The most impressive achievements have been in the progress made in making wind and solar energy competitive with fossil-fuel-produced energy. When I was a physics student, my solid-state-physics professor taught us that, at the time, it took more energy to make a solar panel than it would make throughout its lifetime. Figure 1 shows how dramatically things have changed. A similar story can be told about the cost of electricity obtained from wind turbines.
How did solar power become so cheap? According to Perlin (2002), Bell-lab solar cell pioneer Daryll Chapin put the cost of one watt of solar photovoltaic capacity at $286 in 1956, which corresponds to well over $2,000 in current dollars. The cost of the electricity provided was staggering, but, for the application for which the panels were built, there were no alternatives, since the electricity was required to supply energy for the Vanguard I satellite in 1958. A textbook story from an (old) economics manual would then suggest that, as new solar panels for satellites were built, their prices began to come down, and they found some other not-quite-so-marginal application (say, for lighthouses, or for mountain refuges), increasing demand, production and innovation – in short, setting in motion what economists call the ‘learning by doing’ process.
In reality, this is not what happened. The impressive price improvements shown in Figure 1 have relied, especially in the early phases, on substantial subsidies.[3] In order to entice private investors, the size of the subsidy had to cover the difference in marginal cost between producing one watt of electricity with solar panels and with fossil fuels. As the cost of solar energy has been plummeting, this price difference has become smaller and smaller. So, the amount of solar energy produced (and subsidized) has increased, but the size of the ‘unit subsidy’ has been steadily declining: if the quantity of subsidizes energy has grown exponentially, also exponentially have prices declined, and the total fiscal burden has not grown out of hand. The two blades of the cost scissors have now become so close, that it is beginning to be debatable whether subsidies are still needed for this form of energy production. This ‘easy’ first part of decarbonization financing may, however, soon be over.
Solar panels and wind turbines must, of course, play a key role in the decarbonization of the economy, and their cost is likely to keep on falling. However, the application for which they are most suited, namely the production of electricity, is only a part – between 25% growing to 40% in the medium-term future (ie, circa 2050) – of the energy the world requires. In particular, what Smil (2021) calls the four pillars of the modern world, ie, cement, steel, fertilizers and plastics, all require high-intensity energy that is difficult to produce with renewables. Together these four pillars account for 20% of energy use, and for 25% of emissions. This means that just doing more of the same – only pursuing the renewable-driven abatement strategy, that is, that the private sector has so far found profitable to finance with ever smaller subsidies – will not keep us within the Paris targets.
What are the alternatives? Let’s consider the first, carbon removal and storage. Along every single path in the IPCC models that limits warming to 1.5°C by the end of the century carbon removal, and carbon sequestration and storage, play an important role. The same can be said for most paths that avoid temperature increases greater than 2°C. And herein lies the rub. Consider carbon sequestration and storage (CSS), for instance, for which the technology has been well understood since the 1930s, and which can have effectiveness between 60% and 90%. We are not facing technological barriers to the implementation, but the cost of CSS is currently rather high. Admittedly, if more emitting companies were to embark on sustained programmes of CSS, the magic of learning by doing would certainly kick in, and the cost of capture and storage would probably follow a trajectory similar to the one shown in Figure 1 for solar panels. The problem is that, no matter how cheap it can be made, CSS remains purely a cost.[4] This means that market mechanisms give private investors no incentive to apply CSS: the global-warming externality remains unpriced. And as for Direct Carbon Capture (DCC), it is even more expensive, and cannot be ‘bolted onto’ an existing power plant. So, a private investor in DCC would have to set up a company from scratch to extract at high cost from the air a substance (CO₂) that almost nobody wants to buy. Hardly a viable commercial proposition.
This is where fiscal measures of some form come again to the fore. (By fiscal measures I refer to the variety of initiatives that alter the fiscal budget of a country: these can take the form of the economists’ favourite tax, the carbon tax; or of subsidies; or of tax credits for green energy producers.) The cost of CSS and DCC are indeed likely to fall significantly, but there is no cross-over point (as in the case of solar energy vis-à-vis fossil-fuel energy) beyond which the activity becomes self-sustaining through private investment with no or minimal government help: a cost remains a cost, no matter how small, and some form of inducement or penalty from the government will remain necessary essentially forever.
We have focussed so far on the removal and sequestration part of the equation. But in the case of renewables the investment landscape may also be changing. Some of the more promising locations (in terms of insolation, average wind speed and proximity to an existing grid) have already been exploited. Middle Eastern states that are trying to diversify their revenue stream currently eye with interest the vast desert areas where solar panels could have an energy yield only dreamt of in the cloudy North of Europe. The problem is, however, that solar energy produced in the Sahara cannot be quickly fed into an existing grid for distribution where the energy is needed. Electrons, unfortunately, cannot be transported down pipelines as oil or gas, and transmission over large distances entails substantial losses – the greater the distance, the greater the loss. China has pioneered thousand-kilometers transmission lines, but these have received huge public-finance support.[5] For private investors the infrastructure expenditure of a very-long-distance transmission line on top of the high initial capital costs of renewable installations is likely to be an investment bridge too far.
Similar considerations apply to wind-turbine farms, especially those of the deep-offshore variety. A recent article in The Economist (2024) points out that, even for the distribution of electricity from renewables within a medium-size country like the UK (where wind turbines provide the lion’s share of renewable energy), seven times more grid building will be required every year than it is currently installing. This extra grid capacity is not needed to transport energy over intercontinental distances. More prosaically, currently ‘Scottish wind-farm operators are paid to switch off their turbines when the wind blows strongly because the grid does not have the capacity to send all the electricity they produce to consumers’.[6] Of course, ‘building seven times more grid every year requires a commensurate increase in investment’. Predictably, private investors have only shown interest in building ‘the lower-risk bits of the grid’.[7] This is why a state-owned new entity, GB Energy, is being set up to provide the rest of the required financing. This is a clear indication that, even for the more mundane electrification tasks in what I have called the second phase of decarbonization, public intervention (either in the form of taxes or subsidies, [8] or of higher consumer costs[9]) is needed to entice investors to participate in these initiatives.
The problems with second-generation exploitation of renewable energy are not limited to the absence of existing nearby power network into which the electricity can be fed. Consider, for instance, the case of hydrogen. Hydrogen is frequently touted as a climate solution and could indeed be used to store surplus renewable power when it cannot be fed to the grid,[10] as feedstock or fuel for at least three of Smil’s four recalcitrant pillars of modern society, and as an energy carrier for hard-to-electrify industrial processes and transport.[11] However, hydrogen is still a climate challenge, as it is currently produced from fossil fuels, primarily by steam methane reforming. There are alternatives, such as electrolysis (which involves splitting water into hydrogen and oxygen), but they also require a lot of energy. If this energy comes from burning fossil fuels, the gain in terms of greenhouse gas emissions is not obvious.[12] To provide the energy for its production with renewables, hydrogen should be produced in areas with great insolation and strong winds. Unfortunately, these areas are rarely co-located with the point of energy use and repurposing the existing energy storage and transportation infrastructure to support centralized hydrogen production (which need not make economic or environmental sense) would be very costly, when at all possible. For illustration, existing gas pipelines cannot be repurposed to the transportation of pure hydrogen because of the embrittlement of the pipeline caused by hydrogen (‘pipeline-safe’ blending of hydrogen with gas points to a concentration of hydrogen of at best 15%, and often of only a third of this value).[13]
The engineering details can become very complex, very soon. However, the message also in this case is that, if hydrogen is indeed to play the important role in the economy decarbonization that many commentators expect it can fulfill,[14] substantial infrastructure support must be provided before private actors can be enticed to take up the infrastructure baton. As a consequence, one can see that the joint demands of CSS, DCC and infrastructure creation or repurposing will give rise to a substantial call for public funding. Where is this going to come from?
3 – Financing the Transition
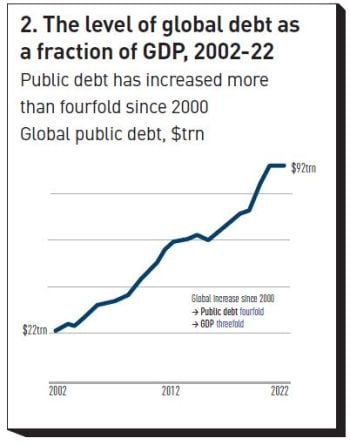
There are mainly two government levers to finance the transition: via increased taxation (either of producers or of consumers)[15], and/or via increased issuance of public debt. Let’s start with the latter. Unfortunately, after years of financial crises, after the COVID epidemic, and after the on-going war in Ukraine, levels of public debt are at an all-time high. US$ debt has climbed by a factor of four from 2000 to 2022, while GDP has ‘only’ grown by a factor of three. See Figure 2. Nobody knows what the sustainable the debt/GDP ratio can be (and this level is clearly strongly country specific, depending as it does on whether the country can print money in the currency in which the debt is denominated – eurozone countries do not have this privilege – and on the fraction of domestic versus foreign investors). However, it is clear that public debt cannot indefinitely grow faster than GDP. The reactions of the UK Gilt market to the unfunded debt implications of the short-lived Truss government suggest that, in a no-longer-close-to-zero rate environment, markets are becoming less forgiving of unbridled borrowing.
In addition, most developed countries are facing a disadvantageous demographic evolution in the coming decades (the ‘climate-change decades’): as populations grow older, the largest component of public spending in every major industrialized country, ie, public pensions and social security will come under greater and greater pressure. If the 2023 reluctance of the French electorate to countenance a modest increase in pension age is representative of a broader reluctance to reduce pension benefits, public expenditure faces strong will headwinds in the decades to come. The aging of the populations of developed countries only reinforces these headwinds when the second largest item of public expenditure is taken into account: healthcare.
What about taxation? Here there is a stark dissonance. In many countries, most voters agree that more should be done to curb climate change. This fails to translate, however, in support of actual taxation. A study by the University of Chicago[16] has found that, at least in 2018, only 42% of American voters believed that climate change is anthropogenic (a necessary condition for any form of taxation to be accepted).[17] As usual, those “Americans who accept that climate change is happening want the government to address it.” However, even among this group, “forty-four percent support and 29 percent oppose a policy to reduce greenhouse gas emissions by taxing the use of carbon-based fuels”. And as for willingness to pay, “57 percent of Americans are willing to pay a $1 monthly fee; 23 percent are willing to pay a monthly fee of $40”. In the most optimistic projection, this would amount to less than $6 bln per year, orders of magnitude less than what is required.
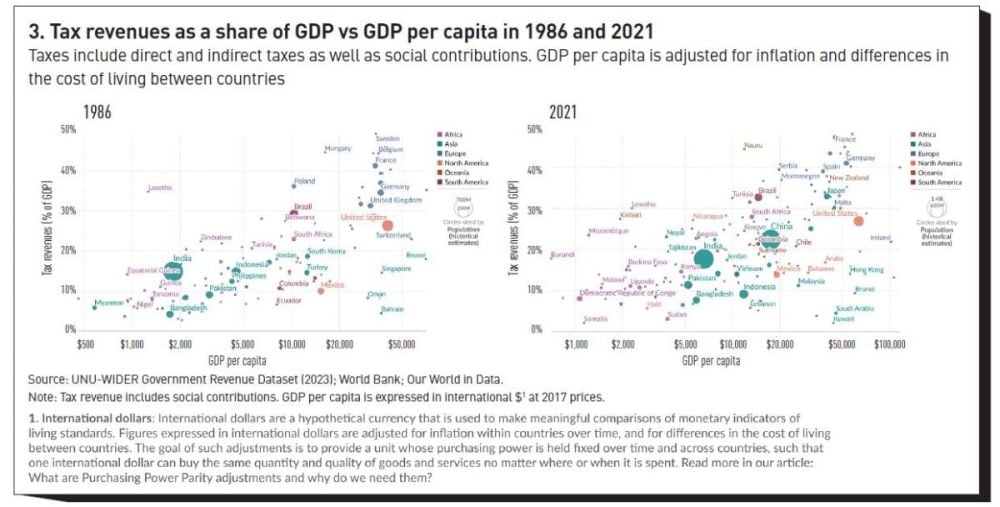
Admittedly Americans are somewhat of an outlier in the Western world in their degree of climate skepticism, and Europeans are more inclined to believe in the reality of the problem, in its anthropogenicity, and in the belief that ‘something must be done’ to curb it. And the desires of Europeans for better services (and pensions) are at least as strong as the American’s. The voters’ willingness to back these beliefs and desires with actual willingness to pay higher taxes remains, however, elusive. Figure 3 shows the level of taxation as a share of GDP versus GDP/person in 1986 and thirty-five years later, in 2021: the slope of the relationship has barely changed, and when large emitter countries have moved up the taxation slope (as in the case of India), this has only been because the country has become richer. The US has bucked the trend, but, as the same figure shows, ‘in the wrong direction’: the average level of taxation has remained virtually unchanged, despite its income (in constant $) having almost doubled.
Overall, while tax revenue as a percentage of GDP climbed strongly in the G7 countries from the 1960s to the 1990s, the upward trend has ground down towards zero for almost every country.[18] The world over, very few, if any, political parties have recently been elected on a platform of higher taxation for higher services. Overall, it seems fair to say that the willingness of the electorate to accept higher taxation levels currently seems extremely limited.
4 – Quantification of the Debt Burden
In a recent document, the IMF[19] have made an estimate of the how much extra debt could be raised in different decarbonization scenarios. Their analysis makes use of a Neo-Keynesian dynamic general equilibrium model with an energy input and a number of different fiscal policies, as in Traum and Yang (2015). The fiscal policies they consider are “carbon pricing, green subsidies, public investment, and targeted transfers, as well as standard taxes on consumption, labor, and capital income”.[20] Two decarbonization paths are considered: “a substantial scaling up of green investment and subsidies to reach the net zero goal [by 2050] […], and a moderate increase in such spending to contain the rise in debt”.[21] In the moderate-increase scenario the emission would only be reduced by 40% by 2050, falling well short, therefore, of the expected emission decrease necessary to stay within the 2°C target by 2100.
The results are sobering. If the amount of investment necessary to reach the net zero goal is undertaken via public-debt financing, the result would be an increase in GDP/debt ratio by 45% by 2050, an increase in debt-GDP ratio that the IMF report describes as “likely unsustainable”. Needless to say, this increase in borrowing would entail higher borrowing costs.
At the opposite end of the spectrum, if the decarbonization were fully financed via taxation in the form of a carbon tax (the form that, as far as emission reduction is concerned, is the most effective and least distortionary[22]) the IMF estimates that a levy of $280/ton would be needed – a level of taxation that, the report understatedly reports “might be politically unpalatable in many countries”. Combining this value with previous estimates[23] of the corresponding tax burden, a carbon tax of this magnitude would equate to an increase in taxation of approximately 6% of GDP. Estimates of the optimal social cost of carbon are notoriously sensitive to model assumptions, but, to give a yardstick for comparison, and leaving aside that overall currently fossil fuel emissions are currently subsidized, carbon trading schemes currently put the cost of 1 ton of carbon emissions at around $30.
The Implications for Asset Pricing
The ‘trilemma’ this state of affairs poses (between public debt, level of taxation, and level of abatement) has awkward policy consequences.[24] Important as these are, we mainly look in this study at the implication for asset prices. If our analysis about the substantial role that public financing must play in what I have called the second phase of decarbonization, the effects of the transition on asset prices are likely to be significant, and negative.
Much as the electorate may dislike higher taxes or higher debt/GDP ratios, we have argued that, if the second phase of the decarbonization process is to take place, a higher reliance will have to be placed on either the fiscal or the debt tool (or both). Can one quantify the effects on asset prices of increased taxation or increased debt on economic growth, the level of rates? In the case of taxation, the outcome strongly depends on how the tax revenues is levied (eg, via a carbon tax, by increase the general level of taxation, via subsidies, etc).[25] In the case of public debt, the analysis is considerably cleaner, and we therefore look at this aspect in some detail.
The first-order effects of increased debt issuance, of course, are going to be on the prices of government debt. Here one must clarify an important point. There have been several studies, reviewed in the excellent paper by Mongelli, Pointner and van den End (2022), aimed at assessing on theoretical grounds how the so-called ‘natural rate of interest’ should be affected by climate change. The natural rate of interest is an important unobservable quantity that serves as benchmark for central bank policy decisions. It can be defined as the real (as opposed to nominal) rate of interest which allows the economy to operate at its full potential without creating unwanted inflationary pressures. Arguably, the Fed funds rate minus spot inflation can be considered a reasonable proxy for the US natural rate of interest. The majority of the theoretical studies reviewed in Mongelli, Pointner and van den End (2022) predict that climate risk is likely to decrease the natural rate of interest. From this, one may be tempted to conclude that bond yields (or at least real bond yields) should also decline as a result of climate risk. This conclusion is however unwarranted. The first reason why one cannot directly translate changes in the natural rate of interest into changes in yields is that there is no concept of credit (default) risk in the definition of the natural rate of interest. In reality, as a government issues more and more debt, investors become more worried about its ability to service the debt, to repay the principal, and to refinance, and demand a yield compensation that increases with the debt maturity. The effect is very strong for emerging-market debt, but also G7 countries can display a similar dynamics: as an example, when in 2008 the UK government had to spend £50 bln to rescue Royal Bank of Scotland, the CDS spread for the same bank and for the UK government only differed by less than 20bp (at one point the spreads were 250bp and 270bp, respectively).
In addition, as Mongelli, Pointner and van den End (2022) point out “[h]igher public spending could also be related to social security expenditure to cover health, emergency housing, relief efforts and other costs stemming from natural disasters. The commensurate increase of fiscal deficits will likely lead to an increase of government debt and the associated higher demand for savings will exert an upward pressure on r*’ [emphasis added].
For our purposes, we will therefore assume in what follows that higher debt issuance will be associated with higher interest rates, through the channel of increased credit risk, and because of higher demand for savings (the investment needed for the ‘second phase’ of the decarbonization). In making this assumption we are in line with the IMF approach to modelling the macro-fiscal implications of climate policies.[26]
An increase in the debt/GDP ratio will cause a decline in price for existing debt, and a higher borrowing cost for new issuance. As corporate debt almost invariably trades at a positive spread to government debt, the impact is expected to be negative also for this asset class. The effect is likely to be more pronounced for countries with more limited debt headroom, ie, for emerging markets that have issued debt in denominated in US$ or in other strong currencies, or for countries that have relinquished the power to print money in the currency of denomination of the debt (Euro block). For all countries, as rates rise, the servicing burden will increase.
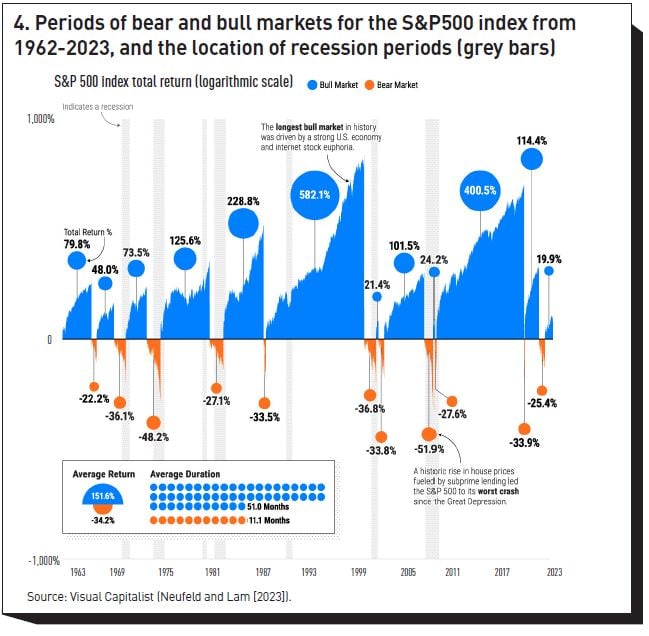
Higher rates will have important repercussions on equity prices as well, via the discounting channel and the related ‘substitution’ effect. A sustained increase in rates would see the dynamics observed during the rate-repression period after the 2008-2009 crisis play out in reverse: while during this period an extremely accommodative monetary policy by central banks worldwide caused a series of ‘controlled mini-asset bubbles’ in virtually every asset class, an increase in rates would be likely to be associated with downward pressure on equity valuations. Figure 4 shows the duration and magnitude of equity bear markets from 1962 to date. Periods of recessions are marked by grey bars, and are almost invariably associated with bear market periods. Since recessions are often ushered in by an increase in rates to curb inflationary pressures, this brings about a negative association between equity valuations and the level of rates. And as the equity-market response to the latest bout of inflationary pressure (and increased rates) testifies, the link between lower equity valuation and higher rates remains active even if an outright recession is avoided.
If the ‘green transition’ is achieved mainly via taxation instead of debt, either the consumers’ spending power or the dividends to equity-holders (or both) will be affected. As mentioned, different forms of taxation have different levels of efficiency, and different macroeconomic impacts. This makes the quantification of the impact on asset prices, but given the estimated magnitude of the fiscal effort, the effect can be expected to be significant.[27]
Both these scenarios are predicated on the decarbonization of the economy taking place at a pace roughly consistent with a 2°C target. It is far from certain, of course, whether this will be the case. However, with any reduction in transition risk (as would happen, that is, if this decisive abatement action is not taken) physical climate risk correspondingly increases. Estimates of the economic impact of higher temperatures vary greatly (see the discussion in Rebonato (2023) and Kainth (2023)), but, under plausible scenarios, they could be very significant – the more so, the greater the margin by which the 2°C warming is exceeded. Since, for a fixed labour-capital split, equity prices reflect changes in economic output with a leverage effect (see, eg, Bansal , Kiku and Ochoa (2019)), the effect on equity valuation can be large also for physical climate risk.
Conclusions
Climate transition risk is understood in two different ways: either the risk of carrying out the required decarbonization of the economy in a disorderly manner (this is the perspective in Bolton and Kacperczyk (2023)); or the risk arising from abating too little or too much. The former interpretation points to the correct and efficient timing of the intervention; the latter, to the overall intensity of intervention. In its second interpretation, transition risk is inversely related to physical risk.
In this note the case has been made that the current global level of debt and willingness to accept higher taxation make type-II transition risk to be strongly skewed in the direction of an insufficient degree of abatement being undertaken. If this is the case, we can expect significant physical risk, with negative repercussions on economic output, consumption and ultimately, equity valuation.
If, instead, the required transition is carried out in a timely manner, we have argued that private financing will be less forthcoming (with limited subsidies) than it has been so far. This will entail either a higher level of national debt, or of taxation, or of both. If the debt level were to increase as much as the IMF (2023) projections suggest, the impact would be strong not only on the price of traded debt, but, via the discounting channel, also on equity valuations. So, either because of physical risk (if the transition takes place too slowly), or because of transition risk (if robust abatement does take place), one should expect a downward pressure on asset pricing. The quantification of this effect is a topic of active research at the EDHEC-Risk Climate Impact Institute.
Footnotes
[1] IPCC Report (2018); see Chapter 4, Strengthening and Implementing the Global Response, Section 4.2.1.1, page 321.
[2] McKinsey (2022).
[3] Incidentally, Pfund and Healey (2011) document that, in its early days, the fossil-fuel industry also enjoyed substantial subsidies, and these were also very effective at lowering the cost of the energy produced. Of course, fossil fuels still enjoy substantial subsidies, but these have a different rationale.
[4] Sequestered carbon can have industrial applications (and therefore a market price), but the applications are either too small to make a difference, or are aimed at squeezing to last drop out of oil deposits – hardly an activity compatible with decarbonizing the economy.
[5] A 1,100 kV link in China was completed in 2019 over a distance of 3,300 km with a power capacity of 12 GW. With these voltages and distances, intercontinental connections become possible. (The high voltage is needed to reduce losses in transmission: power is equal to current times voltage, and the heath ‘friction’ is proportional to the square of current).
[6] Ibid, page 17.
[7] Ibid, page 18.
[8] In microeconomics textbooks subsidies are often described as ‘negative taxes’. This is correct from the point of view of the recipient of the subsidy. The subsidy is however paid by the government out of the available fiscal pot. So, if the same transfers and social benefits are to be kept, additional taxes or debt will have to be raised.
[9] Currently, the costs for grid upgrades are paid for by the consumers of electricity via their bills.
[10] There are several ways to store hydrogen, eg, in salt caves, in porous rock, in lined rock caverns, or in liquid form. See Londe (2023).
[11] For steel making, the direct reduction of iron ore in blast furnaces could be based on hydrogen rather than coke. The efficiency of electric arc furnaces, which can use up to 100% of scrap steel, could also be improved by using hydrogen as a reducing agent and energy vector. Ammonia production relies on hydrogen and could use green hydrogen in lieu of hydrogen derived from fossil fuels; the same is true of plastic production requiring hydrogenation, but this does not offer the same decarbonisation potential. Finally, cement production could use hydrogen as fuel in lieu of fossil fuels and to reduce the amount of clinker needed
[12] In the US, the Inflation Reduction Act has given support to the production of hydrogen from fossil fuel, as long as coupled with Carbon Sequestration and Storage – processes that are currently also expensive.
[13] In regulatory terms, France has the highest hydrogen blending figure at 6% (see https://www.iea.org/data-and-statistics/charts/current-limits-on-hydroge... ), and research commissioned by California suggests that safety concerns appear from blending above 5% . See https://docs.cpuc.ca.gov/PublishedDocs/Efile/G000/M493/K760/493760600.PDF ).
[14] See Tarvydas (2022).
[15] Taxation of consumers or producers have different economic and redistributive consequences. Producer taxation, in particular, can result either in increased consumer prices (if the producers have enough ‘pricing power’), or in reduced dividends. Quanity controls have the effect of a tax on consmumers (if, because of scarcity, they bring about an increase in price), and/or on dividends (because of reduced profits). Only in a world with perfect knowledge of production costs are quantity controls equivalent to taxation.
[16] NORC (2018).
[17] These findings are not unique. A recent survey by the Yale University Program on Climate Change Communication shows that only 32% of Conservative Republicans believe that climate change will harm the US. Even adding Liberal/Moderate Republicans and Independents, this fraction only increases to 58% and 64%, respectively.
[18]In most developed countries, taxation is progressive, and therefore when income falls during a recession, tax revenues decline more strongly than GDP. This effect has been particularly pronounced during the 2008/2009 financial crisis, and makes the detection of the underlying trend difficult.
[19] IMF (2023).
[20] Ibid, page 4.
[21] Ibid, page 4.
[22] There are, of course, redistributional issues associated with a carbon tax. These are in practice very important (witness the popular gilet jaunes reaction to a modest carbon tax in France in 2018), but they are not considered in this study.
[23] IMF (2019)
[24] “[C]arbon pricing is often unpopular, thus transforming the trade-off into a trilemma between achieving climate goals, fiscal sustainability, and political feasibility.”, page ix-x.
[25]For detailed discussion, see, eg, IMF (2019) .
[26] See Garcia and Nguyen (2022). See, in particular, “Sovereign interest rates are increasing in the debt-to-GDP ratio to capture the downward-sloping demand for safe assets, which is particularly relevant for countries with less fiscal space”, pages 2-3.
[27] Of course, equity holders are consumers themselves, so that reduced dividends will also impact purchasing power. More broadly on debt vs tax, one key question is the textbook Ricardian equivalence: David Ricardo 's point was that government debt will need to be repaid (via increased tax at some point) leading to an equivalent impact on households of the two funding choices. Empirically, it has been recorded that agents are imperfectly Ricardian and anticipate only partially the need to fund government spending (and curtail their spending in anticipation).
References
Bansal, R, D. Kiku, M. Ochoa (2019). Climate Change Risk, Federal Reserve Bank of San Franisco working paper, 1-75.
Bolton, P., and M. Kacperczyk (2023). Global Pricing of Carbon-transition Risk. Journal of Finance 78, (6) 3677-3754
Farmer, J.D, and F. Lafond (2016) How predictable is technological progress? Retrieved on 12 December 2023 from https://www.sciencedirect.com/science/article/pii/S0048733315001699
Garcia, M.D, and A. Nguyen (2022). IMF Fiscal Monitor, Online Annex 1.2. Macro-Fiscal Implications of Climate Policies.
International Monetary Fund (2019). Fiscal Monitor – How to Mitigate Climate Change, October.
International Monetary Fund (2023). Fiscal Monitor, Climate Crossroads: Fiscal Policies in a Warming World, October, 1-104.
International Renewable Energy Agency (2023). Renewable capacity statistics 2023. Available here: https://www.irena.org/Publications/2023/Mar/Renewable-capacity-statistic...
IPCC (2018). Global Warming of 1.5°C.
Kainth, D. (2023). Review of Damage Functions, Working paper, EDHEC Risk Climate Impact Institute.
Londe, L. (2023). Four Ways to Store Large Quantities of Hydrogen, Geostock, retrieved from https://www.geostockgroup.com/en/four-ways-to-store-large-quantities-of-....
McKinsey & Company (2022). The Net-Zero Transition - What It Would Cost, What It Could Bring, Report, January.
Mongelli, F.P., W. Pointner and J.W. van den End (2022). The Effects of Climate Change on the Natural Rate of Interest: A Critical Survey, European Central Bank working paper, no 2744, November, 1-32
Nemet, G.F. (2009). Interim monitoring of cost dynamics for publicly supported energy technologies. Retrieved on 12 December 2023 from https://pcdb.santafe.edu/graph.php?curve=158
Neufeld, D., and S. Lam (2023) Visualizing 60 Years of Stock Market Cycles, Visual Capitalist, 21 December.
NORC (2018). University of Chicago, Is the Public Willing to Pay to Help Fix Climate Change? Available at https://apnorc.org/projects/is-the-public-willing-to-pay-to-help-fix-cli...
Perlin, J. (2002). From Space to Earth: The Story of Solar Electricity, Harvard University Press.
Pfund, N., and B. Healey (2011). What Would Jefferson Do? The Historical Role of Federal Subsidies in Shaping America’s Energy Future, DBL Investors White Paper, September, 1-38.
Rebonato, R. (2023). Portfolio Losses from Climate Damages – A Guide for Long-Term Investors, EDHEC Risk Climate Impact Institute white paper, November, 1-35.
Rebonato, R., D. Kainth and L. Melin (2024) Climate Scenario Analysis and Stress Testing for Investors: A Probabilistic Approach, EDHEC-Risk Climate Impact Institute white paper, January, 1-72.
Smil, V. (2021). Great Transitions, Oxford University Press, Oxford, UK.
Tarvydas, D. (2022). The role of hydrogen in energy decarbonisation scenarios, Publications Office of the European Union, Luxembourg doi:10.2760/899528, JRC131299. Available at: https://publications.jrc.ec.europa.eu/repository/handle/JRC131299 .
The Economist (2024) Energy – The Great Rewiring, 6 January.
Traum, N., and S.-C. Yang (2015). When Does Government Debt Crowd Out Investment? Journal of Applied Econometrics 30(1): 24-45.
UNU-WIDER Government Revenue Dataset (2023). Available here: https://www.wider.unu.edu/project/grd-government-revenue-dataset
World Bank (2023). Global Economic Prospects. Available here: https://openknowledge.worldbank.org/server/api/core/bitstreams/6e892b75-...
Rubrique
About EDHEC
Operating from campuses in Lille, Nice, Paris, London and Singapore, EDHEC is one of the world’s top 15 business schools. Fully international and directly connected to the business world, EDHEC commands a strong reputation for research excellence and the ability to train entrepreneurs and managers capable of breaking new ground. EDHEC functions as a genuine laboratory of ideas and produces innovative solutions valued by businesses. The School’s teaching is inspired by its research work and a focus on “learning by doing”, all with the aim of equipping people with the skills to succeed in business.
