
The Impact of Climate Change News on Low-minus-High Carbon Intensity Portfolios
By Jean-Michel Maeso, Senior Quantitative Researcher, EDHEC-Risk Climate Impact Institute; Dominic O’Kane, Research Director, EDHEC-Risk Climate Impact Institute; Professor of Finance, EDHEC Business School
- Recent literature has sought to investigate the correlation between climate news and equity market performance, with the aim of quantifying a measure of a so-called ‘climate beta’.
- Using a variety of language models and high-quality English-language newspaper sources, including the Financial Times and New York Times, we construct an unexpected climate news index (UCNI) for each model and source.
- We measure the impact of these UCNIs, plus an aggregate UCNI over all the news sources, on a range of Low Carbon Intensity (LCI), High Carbon Intensity (HCI), and Low-minus-High Carbon Intensity (LmHCI) equity portfolios, constructed by sorting S&P 500 firms based on their carbon intensity.
- For most of the language models considered, the sensitivity of returns to an increase in the corresponding aggregated UCNI index, is negative and statistically significant at 1% for HCI portfolio returns, but it is not significant for LCI portfolio returns.
In recent years, several papers, beginning with Engle (2020), have examined the link between climate news and equity market returns, hoping to identify a measure of a so-called “climate beta”. Using a variety of language models and high-quality English-language newspaper sources, including the Financial Times and New York Times, we also construct an unexpected climate news index (UCNI) for each model and source. We measure the impact of these UCNI, plus an Aggregate UCNI over all the news sources, on a range of Low Carbon Intensity (LCI), High Carbon Intensity (HCI), and Low-minus-High Carbon Intensity (LmHCI) equity portfolios, constructed by sorting S&P 500 firms based on their carbon intensity. We find that the relationship between the UCNI and the LCI, HCI, and LmHCI portfolio returns is overall not statistically significant for individual news sources across all the language models. However, it does become significant for all the Aggregate UCNI indices, suggesting that combining different news sources increases the signal to noise ratio of the climate beta. For most of the language models considered, the sensitivity of returns to an increase in the corresponding Aggregated UCNI index, is negative and statistically significant at 1% for HCI portfolio returns, but it is not significant for LCI portfolio returns. This is for the period from July 2012 to November 2021. These results suggest that the UCNI factor extracted from an Aggregate news index is a climate risk proxy whose beta coefficient can explain the returns of HCI and hence LmHCI portfolios.
News data
To perform this analysis, we require digitized, daily, English-language, high-circulation and high-quality news sources with a European and US perspective, including at least one with a dedicated financial market focus. For these reasons we have chosen the following news data sources:
The Financial Times (FT) digital archive. The Financial Times is widely recognized as the leading European English-language financial newspaper. It is published daily, except Sundays, and covers not just business news, but also world politics and current affairs.
The Lexis Nexis (LN) database of newspapers. This provides access to many thousands of newspapers internationally. From these we selected the New York Times (NYT), the Los Angeles Times (LAT), The Guardian (UKG) and The Daily Telegraph (DT).
We use articles from these news sources, grouped at a daily frequency, over the period from 2 January 2005 to 3 November 2021. We assume that an article appears in the morning of the first publication date. This can be a different time depending on whether the news source is in the US or Europe. As Europe is several hours ahead of the US, the arrival of news from US and European news sources will impact the US equity market on that same day. To align the arrival of weekend news with the financial markets, we adjust the publication date of news stories that appear on a Saturday or Sunday to the following Monday, the earliest date on which this news can impact the US equity market. We do not rely on any tagging provided by the news sources.
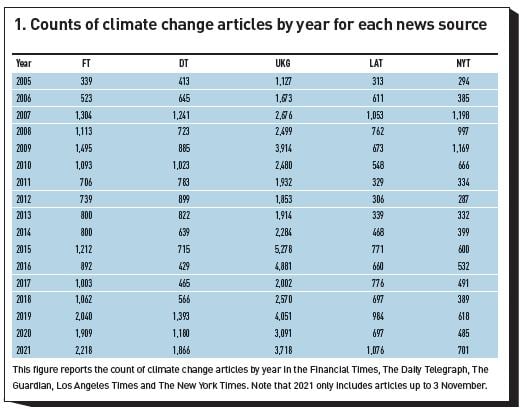
We wish to extract only climate change-related articles and do so by selecting only those articles that contain one or both bigrams ‘climate change’ and ‘global warming’. Exhibit 1 shows the counts of the total number of selected articles per newspaper, per year. We see that the UK Guardian is the leading publisher of climate change-related articles over time among our corpus of news sources, followed by the Financial Times and Daily Telegraph.
We consider news in the form of newspaper articles and so each article has a headline and content. The headline is typically added by a sub-editor who has read the article and wishes to summarize the key message of the article for the reader. To assist the reader, the headline usually reflects the most important part of the article and any associated positive or negative sentiment. For this reason, we examine both the article headline and the article content to see if the headline can provide a clearer measure of article focus and sentiment than an analysis of its longer and more complex content.
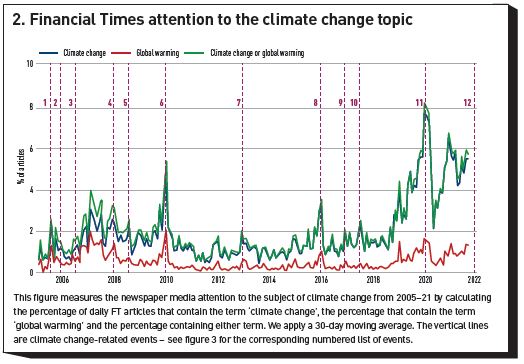
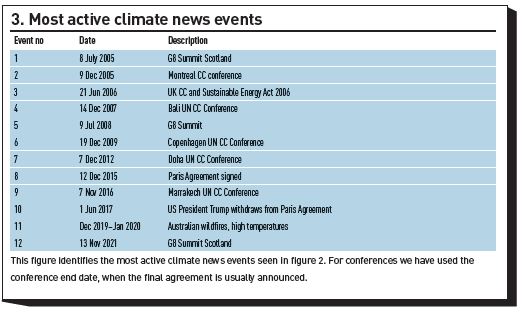
To quantify the newspaper media’s attention to climate change, we first need to identify a climate change article. Care needs to be taken to avoid false positives. Hence, we search for bigrams - combinations of two words - that ensure the subject matter is related to climate change. Work by Engle et al. (2020) and others has done this using the search term ‘climate change’. However, the bigram ‘global warming’ has also been widely used as a synonym. To determine whether we should include it, we perform searches for articles that contain (i) ‘climate change’, (ii) ‘global warming’, and (iii) one or both of ‘climate change’ or ‘global warming’. We focused on the Financial Times news source and calculated the fraction of daily articles that are returned by these search terms. Using the fraction of articles, rather than the number, corrects for the fact that the total number of daily Financial Times articles has varied significantly over this period[1]. All three of these time series are shown in Exhibit 2. We observe that use of the bigram ‘global warming’ has declined in relative terms over time, but it is still used. The bigram ‘climate change’ has clearly become the dominant bigram. To ensure that we capture as many climate change articles as possible, and especially those in the earlier period of analysis, we include both in our definition of a climate change article. Using this definition, Exhibit 3 shows the count of the total number of such articles per newspaper, per year.
Climate change news indices overview
We explore several approaches for constructing a climate change news index (CNI) from newspaper articles. If there is a link between climate change news and market price movements, then we would expect the link to be strongest for the index that best captures the quantity, content and sentiment of the climate change news. The index construction approaches we use, in order of increasing level of sophistication, are as follows:
- Attention - The number of climate change articles published each day.
- Similarity - The TF-IDF[2]cosine similarity between each day’s climate change articles of the newspaper and a representative climate change document.
- Concern - Climate change concern using word-frequencies based on the LIWC lexicons[3]. Concern is high if the number of “negative words” in a climate change article is higher than the number of “positive words” and the fraction of “risk words” is high.
- VADER - We use a rules-based lexical approach called VADER that assigns a sentiment polarity score to specific words to determine if the climate change article sentiment is positive or negative.
- BERT with Fine-Tuned Sentiment - We take a BERT language model as described in Devlin et al. (2018) and fine-tune it to identify sentiment using human-labeled, finance-related training examples.
- ClimateBERT with Fine-Tuned Sentiment - We take the domain-specific Climate- BERT model by Webersinke et al. (2021) and fine-tune it to identify sentiment using human-labeled, finance-related training examples.
Our simplest Attention-based measure counts the daily number of climate change articles published. Such an approach was analyzed in the media bias model of Gentzkow & Shapiro (2010), who noted that the number and length of the articles reflect reader interest. For the next level of sophistication, we use an approach that detects actual semantic meaning within the news articles by quantifying the degree of emotional concern. This is a challenging task as the emotional sentiment of long and highly articulate articles is not always simple to extract. For this reason, we then turn to state-of-the-art language models such as the BERT Transformer-based model from Devlin et al. (2018), and finally to the CBERT model by Webersinke et al. (2021) which has been specifically designed to better understand climate-related texts. We developed two language models for the VADER, BERT and ClimateBERT approaches presented earlier: one using headlines (VAD-H, BERT-H and CBERT-H) and another using article content (VAD-S, BERT-S and CBERT-S) for sentiment analysis.
We use these different approaches to construct a family of climate news indices (CNI), each a daily time series from 2005 to 2021. We do this for both the article content and the article headline. The headline is short and should indicate the sentiment of the article. As such it may be easier to extract the article’s sentiment from the headline than the entire article.
To perform a market analysis using our climate change news indices, we must first isolate the unexpected component of the daily climate change news index changes. To do this, we assume that the CNI obeys an AR(1) process where the changes in unexpected climate change news are the innovations. Calibrating the CNI to this process allows us to extract a family of unexpected climate change news innovation (UCNI) indices. We refer the reader to Maeso et al. (2023) for further details on the construction of these indices.
A Source-Aggregated Climate Change News Index
In addition to the set of CNI for each news source, we also wish to construct a single aggregated index across all five news sources. Doing this increases the total number of articles being used in the construction of this index and might be expected to reduce any statistical noise in the article counts and so enhance any signal that may exist across the individual indices.
Rather than simply average the individual newspaper indices, we first standardize them so that each index has a unit standard deviation over a three-year period of T dates. This ensures that a newspaper index that experiences a high level of variability in both article number and sentiment score is adjusted to be more comparable with a newspaper index that has a lower variability. Hence, for each news source b, and index  , the standard deviation of the index is calculated as:
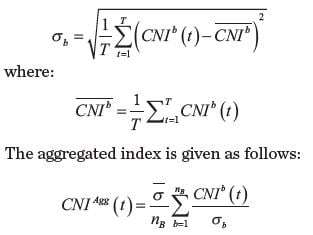
where 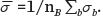 The aggregate index at date t has been standardized by a volatility estimated over a three-year rolling window prior to t, so there is no look-ahead bias.
Climate change news and equity portfolios
We first assign each stock of the 500 US stocks with the largest capitalization (according to CRSP) to one of the three categories of “LCI”, “neutral” and “HCI” on a given date. To identify which stocks are LCI and which are HCI, we use a selection method that is based on the carbon intensities of individual companies. These have been determined using combined Scope 1 and Scope 2 emissions from FactSet’s ISS ESG carbon emissions data. A stock is labeled to be LCI if the corresponding company has low CO2 emissions per unit of revenue and similarly a stock is labeled as HCI if the corresponding company with high CO2 emissions per unit of revenue. The remaining stocks are labelled as “neutral”. Vaucher et al. (2023) underline that several papers such as Ardia et al. (2022) rely on this metric to sort stocks but other papers can use up to 10 different metrics such as environmental scores or to sort stocks (see Görgen et al. (2020) for more details).[4]
Given a set of climate change news indices (CNI) described above, the next step is to determine whether these indices have an impact on equity returns. We examined three liquid US stock portfolios engaged respectively in a LCI strategy, a HCI strategy, and a LmHCI portfolio strategy, that we expect to be sensitive to climate change risk. The LCI portfolio and HCI portfolio are equally weighted and consist of the 30% of stocks with respectively the lowest and highest carbon intensity.[5]
The CNI indices that we have calculated may embed some auto-correlation effects and these must be removed if we are to correctly capture the unexpected changes in the climate news index. The unexpected climate news innovations index,  , are defined by:
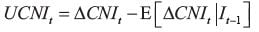
Where  is the information to time
  . Each value of the
  is calculated as the residual of an AR(1) process calibrated to the
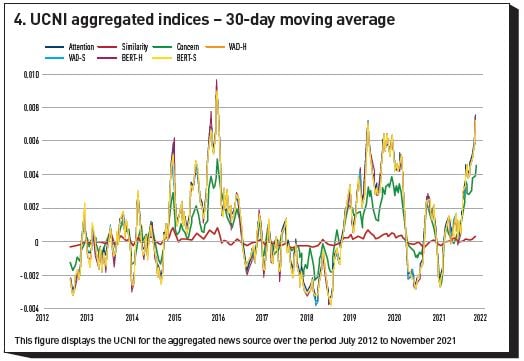
  over the previous three years. The Aggregate for the different language models are shown in Exhibit 4.
Then we examine whether differences in exposure to the climate news index help us to explain expected returns of LCI, HCI and LmHCI portfolios. The linear regression we wish to fit is the following:
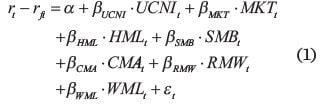
where MKT is the excess market return, SMB the small minus big (size) factor, HML the high minus low (value) factor, RMW the robust minus weak (high profitability) factor, CMA the conservative minus aggressive (low investment) factor, and WML the winners minus losers (momentum) factor.
The left-hand side is the daily excess return of the portfolio under study where  is the risk-free rate. We want to determine if, for the linear regression, the factor loading on the aggregated is statistically significant. This will test the model of Pastor et al. (2021) which predicts a strictly positive
  coefficient for the LCI and LmHCI portfolios and a strictly negative coefficient for the HCI portfolio. We will also study the statistical significance of coefficients.
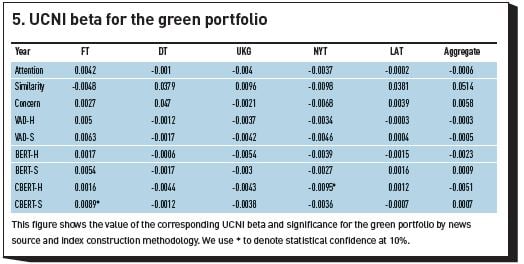
We apply the linear regression written in Equation (1) to the LCI, HCI and LmHCI portfolios. Exhibit 5 reports the coefficient for the green portfolio. These results have low significance and hence the impact of climate news on LCI stock returns is low.
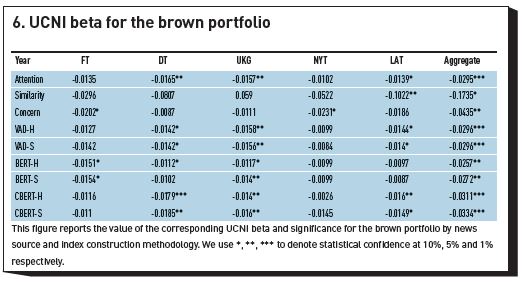
Exhibit 6 shows the equivalent UCNI beta for the HCI portfolio for the different news sources, including the aggregate news source. We note that the betas are all negative, implying that a day with high unexpected negative concerns is, on average, always associated with a negative impact on the returns of HCI stocks. Significance for the individual news source betas is reasonably high with some at 10%, 5% and one at 1% significance (CBERT-H). However, for the aggregate index, the significance improves substantially, and five of the nine indices have significance at 1%, three having significance at 5% amongst the other four
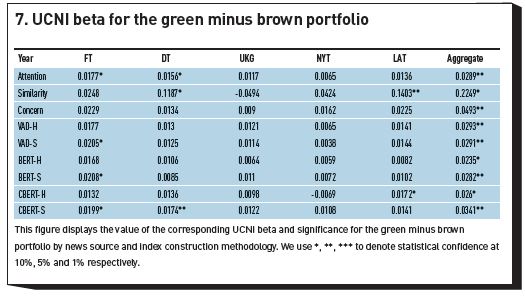
Exhibit 7 shows the UCNI beta coefficient for the LmHCI portfolio for the linear regression performed over the period from July 2012 to November 2021. The first observation is that the betas are mostly positive: unexpected negative climate sentiment is associated with a positive return due to a fall in value of the short position in the HCI stocks. Once again, the climate beta statistical significance is greatest for the Aggregate indices, with six out of nine climate betas showing statistical significance at 5%.
Portfolio performance conditional on the UCNI
We examine whether unexpected climate news innovations can help predict the conditional performance of HCI versus LCI stocks. To do this, we study the average daily performance of the LmHCI portfolio over the period from July 2012 to November 2021, conditional on the level of the daily UCNI index. We define three different regimes which we call low, medium, and high. The low regime corresponds to days when the UCNI time series is below the first tercile, the medium regime to days when the UCNI time series is between the first and the second terciles, and the high regime to daily periods when the UCNI time series is above the second tercile.
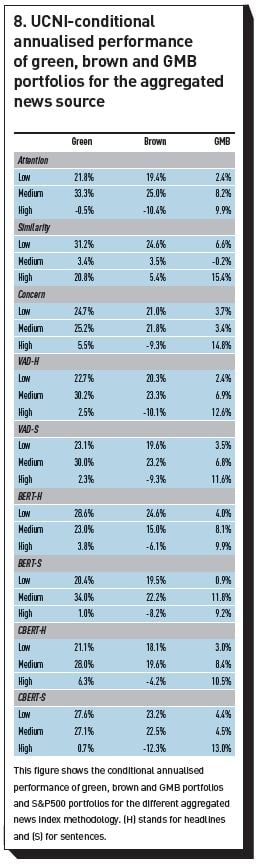
Exhibit 8 reports the conditional performance of the LCI, HCI and LmHCI portfolios with respect to UCNI calculated from the Aggregate news source. The average annualized return of the LmHCI portfolio over the high regime is greater than that over the medium and low regime for all the methodologies under study. We also find that the average annualized return of the LmHCI portfolio in the medium regime is greater than that over the low regime for all the methodologies under study. For example, choosing the ClimateBERT sentences index it is 13.0% in the high regime versus 4.4% in the low regime. We see that when the UCNI is in the high tercile, the return of the HCI portfolio is negative for all the indices except the similarity index.
Conclusion and extensions
Our evidence suggests that the UCNI factor built on an aggregate index of high-quality newspapers has an explanatory power over the HCI portfolio returns, and hence over LmHCI portfolio returns. The improved significance of an aggregate index over individual indices points to that individual newspapers may publish climate change articles even when there is no climate change event to report. By aggregating these newspapers, we reduce the importance of these idiosyncratic articles while retaining the importance of the climate articles which they all publish - those which report on actual unexpected climate news events.
Our findings agree with the general observation by Ardia et al. (2022) who find that LCI firms outperform HCI firms when there are unexpected increases in climate change concern. Unlike Ardia et al. (2022), we find that this is not because LCI stocks rise in value, but because HCI stocks fall in value. This result is consistent with the results of Bua et al. (2020) and is true for simple attention measures which do not study the article sentiment. This implies that unexpected climate news is generally bad for HCI assets, perhaps because HCI firms may have more to lose from climate change news than LCI assets have to gain.
Furthermore, we find that, conditional on the level (low, medium, high) of the UCNI, the average return of LmHCI portfolios over the period from July 2012 to November 2021 is always increasing with the level of the UCNI across all the different index types. This adds supports to the hypothesis that there is a role played by climate change concern on the longer-term performance of LmHCI portfolios.
Out of all the language models used, the most advanced domain-specific ClimateBERT model did not materially outperform the simpler Attention-based model. This indicates that it is the number of articles, rather than their content, that drives climate risk awareness. It may also imply that the ability of these state-of-the-art language models to extract sentiment from high quality newspaper articles is limited. This may be due to the complexity of the language found in these newspapers’ articles or to the desire of serious newspapers to be even-handed and moderate in tone.
There are several possible extensions of our paper. First, we may wish to add more individual news sources to the aggregated index to see the impact on the significance of the aggregate index. Second, it would be of interest to explore aspect-based sentiment approaches such as Peng et al. (2020). Using such an approach we can ensure that the target of the expressed sentiment is indeed a climate change related matter. It may then be possible to distinguish between LCI and HCI targets. Third, it would be of considerable interest to determine whether the out-of-sample performance of the aggregate UCNI is sufficient to enable us to use it for portfolio hedging as initially proposed by Engle et al. (2020).
The research from which this article was drawn was supported by Amundi.
Footnotes
[1] Over the 2005-2021 period the monthly number of Financial Times articles ranged from around 2,000 in 2006 to over 6,000 in 2014 and then back down to around 3,000 in 2020.
[2] TF-IDF is the Term Frequency Inverse Document Frequency metric. It measures how important a word is to a document located in a collection of documents.
[4] Vaucher et al. (2023) emphasize that sorting stocks according to carbon intensity may lead to large weights toward sectors that are not relevant from a climate policy standpoint according to the classification of economic activities developed after Battiston et al. (2017) to assess climate transition risk. This classification is called Climate Policy Relevant Sectors (CPRS).
[5] We also tested an alternative approach for the GMB portfolio construction developed by Vaucher et al. (2023). The long (green) leg of the GMB portfolio is built as an equally-weighted (EW) portfolio of the 50% of the stocks with the lowest carbon intensity selected within each of the six CPRS sectors. Conversely, the short (brown) leg is built as an EW portfolio of the 50% of the stocks with the highest carbon intensity selected within each of the six CPRS sectors. The findings generated via this alternate methodology concur with those obtained through the initial methodology.
References
Ardia, D., K. Bluteau, K. Boudt and K. Inghelbrecht (2022). Climate Change Concerns and the Performance of Green Versus Brown Stocks. Working Paper Available at SSRN: https://ssrn.com/abstract=3717722.
Battiston, S., A. Mandel, I. Monasterolo, F. Schütze and G. Visentin (2017). A Climate Stress-Test of the Financial System. Nature Climate Change 7(4): 283-288.
Bua, G., D. Kapp, F. Ramella and L. Rognone (2020). Transition Versus Physical Climate Risk Pricing In Euro Area Financial Markets: A Text-Based Approach. ECB Working Paper.
Devlin, J., M.-W. Chang, K. Lee and K. Toutanova (2018). BERT: Pre-training of Deep Bidirectional Transformers for Language Understanding. arXiv preprint arXiv:1810.04805.
Engle, R., S. Giglio, B. Kelly, H. Lee and J. Stroebel (2020). Hedging Climate Change News. The Review of Financial Studies 33(3): 1184–1216.
Gentzkow, M. and J. Shapiro (2010). What Drives Media Slant? Evidence from U.S. Daily Newspapers. Econometrica 78 (1): 35–71.
Görgen, M., A. Jacob, M. Nerlinger, R. Riordan, M. Rohleder and M. Wilkens (2020). Carbon Risk Available at: https://ssrn.com/abstract=2930897 or http://dx.doi.org/10.2139/ssrn.2930897.
Maeso, J.M. and D. O’Kane (2023). The Impact of Climate Change News on Green-minus-Brown Portfolios. EDHEC-Risk Climate Working Paper.
Pastor, L., R. F. Stambaugh and L. A. Taylor (2021). Sustainable Investing in Equilibrium. Journal of Financial Economics 142 (2): 550–571.
Vaucher, B., V. Bouchet and B. Herzog (2023). Look up! A Market-Measure of the Long-Term Transition Risks in Equity Portfolios. Working Paper. Scientific Portfolio.
Webersinke, N., M. Kraus, J. Bingler and M. Leippold (2021). ClimateBert: A Pretrained Language Model for Climate-Related Text.
Rubrique
About EDHEC
Operating from campuses in Lille, Nice, Paris, London and Singapore, EDHEC is one of the world’s top 15 business schools. Fully international and directly connected to the business world, EDHEC commands a strong reputation for research excellence and the ability to train entrepreneurs and managers capable of breaking new ground. EDHEC functions as a genuine laboratory of ideas and produces innovative solutions valued by businesses. The School’s teaching is inspired by its research work and a focus on “learning by doing”, all with the aim of equipping people with the skills to succeed in business.
