Investing in Times of COVID
by Riccardo Rebonato, Professor of Finance, EDHEC-Risk Institute

If an investor did not know the meaning of the word COVID, and could only observe the level of the S&P500 in January 2020 and one year thereafter, she could be forgiven for thinking that COVID must be something very good for the economy, as over this period the index climbed from 3,200 to above 3,800. And if she still harboured any doubts, she could check the BofA High-Yield index, which stood at 5.23% one year ago, and, as I write, hovers below 4.5%. Definitely, this COVID thing must not only be good for the economy but also make corporate balance sheets more solid.
Alas, we know better – but the task of explaining the prices of assets is not made any easier by our knowledge of what a coronavirus is. Western economies have seen a precipitous drop in GDP, individuals and corporates are being saved from bankruptcy by various government aid schemes, and governments are more indebted than they ever were in peace times. So why are assets so optimistically priced? We teach our students that prices reflect expected cashflows, discounted so as to account for risk. Since prospects for cashflows must be worse than they were a year ago, and uncertainty must have increased, why have prices not just held up, but positively rallied?
We cannot make sense of this price behaviour without taking into account the actions of the central banks – and Quantitative Easing (QE) in particular. The demands made of QE have morphed over time: in the days right after the sub-prime debacle, QE was focussed on easing mortgage rates, and thereby reviving the moribund housing market. In the next phase, its task became to ease credit conditions in general and stimulate investments. However, during what economist Richard Koo would call a classic ‘balance sheet recession’ (when everybody tries to shore up their balance sheet), the credit-stimulative effect of lower rates is dubious. Therefore, as the latest twist in the QE story goes, the asset bubbles that are being created through asset purchases make asset holders richer, and they should spend more.
We cannot make sense of this price behaviour without taking into account the actions of the central banks – and Quantitative Easing (QE) in particular
But QE has deeper implications than just propping asset prices. In the current COVID world, the printing-money magic of QE, whereby money is conjured in the pockets of asset holders, has also thrown a lifeline to the embattled treasuries of Western countries – treasuries that are faced with the conundrum of what do with the deficits created by the unprecedented, and still open-ended, largesse of the various furlough schemes. In the newest normal, instead of raising taxes or cutting benefits, another option has been made available by QE: normally, if government debt is sold to investors, their purchases will reduce the balances in their current accounts – the opposite effect of QE asset purchases. But if the same debt is bought with newly minted money by the central bank, there is no drop in the cash holding of Joe Public, and no contraction in demand. Finance ministries are effectively borrowing money from themselves.
For a central bank that can print money in its own currency (the US, Japan and the UK, but not the EUR countries), this monetary alchemy can continue ad infinitum, as long as inflation does not materialize. And nobody quite understands why, but, somewhat magically, despite this frantic money printing, inflation appears to remain subdued. This is what has allowed this high-wire act to continue.
If this analysis is correct, surely investors must be scrutinizing the inflation tea leaves more carefully than ever before. The treasury markets of the US, the UK and the ECB (Bunds) suggest that this is not at all the case. I have calculated, either from the market prices of inflation-linked securities, or from long-term inflation trends, real yields and inflation for the US Treasury, Gilt and Bund markets, and compared them with nominal yields. By doing so, I was trying to see whether the inflation or the real-rate dog has been wagging the nominal-yield tail. Since estimating long-term trends is fraught with technical difficulties, I have used four different detrending methods (reported in the references)[1], but with little difference in the results. What did I discover?
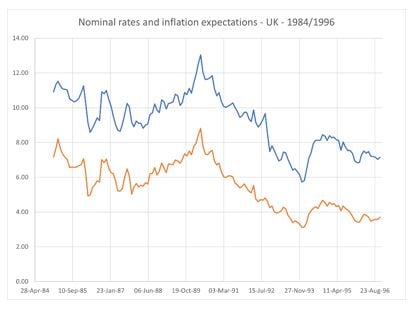
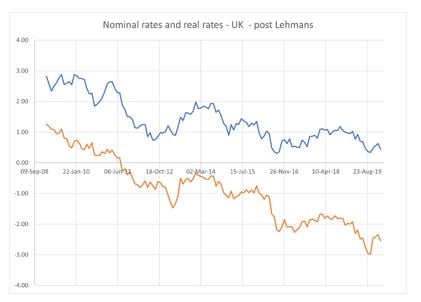
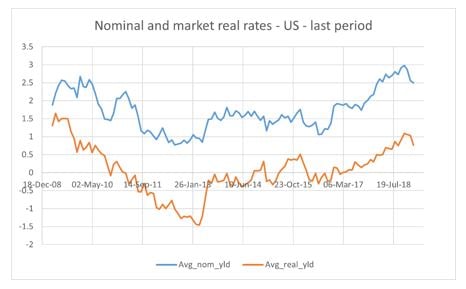
I found that in the 1970s and 1980s nominal yields were strongly driven by inflation expectations. However, starting in the late 1990s, inflation ceased to have much explanatory power for the level of nominal yields, which are now almost fully driven by real rates. Indeed, looking at data from the mid-1970s to now, depending on the exact detrending method, the correlation between nominal yields and inflation expectations was as high as 80% in the first third of the data, dropping to about 30-40% in the last two fifths of the sample. However, the correlation between nominal and real yields, as low as 28% in the first third, climbs as high as 96% in the last period. Figs 1 to 3 tell the story for USD and GBP: in a nutshell, today’s investors do not seem to be paying any attention to inflation – despite the fact that central banks are printing money as they have hardly ever done before.

Fig1: The time average of the continuously compounded UK nominal yields and UK inflation expectations (y-axis, in percentage points) for maturities from 1 to 10 years (x-axis, in years), for the period 1984–1997

Fig 2: The time average of the continuously compounded UK nominal and real yields (y-axis, in percentage points) for maturities from 1 to 10 years (x-axis, in years), for the period 2008–2019

Fig 3: The average real US yields from TIPS prices (line labelled ‘Avg_real_yld') and the average US nominal yields (line labelled ‘Avg_nom_yld') in the post-Lehman period. Percentage points on the y axis
The time average of the continuously compounded UK nominal yields and UK inflation expectations (y-axis, in percentage points) for maturities from 1 to 10 years (x-axis, in years), for the period 1984:1997.
What are the implications of all this for investors? First of all, the money-printing party can continue only as long as inflation is, and is perceived to be, firmly under control. The inflation credibility of the central banks is likely to be tested at some point in the medium-term future. Investors should be therefore paying a lot of attention to inflation trends – as we have seen, currently they are not. The experience of the 1970s shows that inflation can rise very quickly, very steeply. Long-term lenders, short-term borrowers and investors in general should look at Figures 1 to 3 with attention – and a bit of trepidation.
Today’s investors do not seem to be paying any attention to inflation
Second, the same investors should also differentiate carefully between central banks with a high and low degree of independence. If the inflation genie is let out of the bottle, it may become mighty difficult to get it back in – and that is when the independence of central banks will be tested, not in these inflation-benign times. Real assets have in this respect an obvious advantage over nominal ones.
Third, if inflation is kept under control, it will still make a huge difference whether a country can print its own money, or, as in the case of the EURO zone, is unable to do so. Peripheral EURO-zone countries in general, and those with a chequered history of inflation control in particular, may find themselves between a rock and a hard place.
Fourth, while strong economies with credible central banks and the ability to issue debt in their domestic currency may well be able to borrow their way out of the COVID slump, this option is unlikely to be available to fragile economies, or to economies that have borrowed in non-domestic currencies. As these are often the same, the prospects are not brilliant for emerging markets. As Sebastian Mallaby, Senior Fellow for International Economics at the Council on Foreign Relation, pithily put it, “in much of the developing world, there is no [money] magic, only austerity”. We have seen how well this worked as we exited the sub-prime crisis.
Real assets have in this respect an obvious advantage over nominal ones
Fifth, a period of rising rates usually ushers in a difficult period for asset owners. This tends to be true even if rates are raised because the economy if firing on all cylinders. However, if rate hikes were forced on reluctant central bankers by a surge in money-printing-driven inflation while the underlying economy was still weak, the repercussions on the prices of equities, treasuries and corporate debt could be devastating.
Finally, the QE originally targeted ‘money-good’ financial assets – assets, that is, that may have been experiencing a temporary depression in prices, but whose ultimate cashflows were in no doubt. With the foray of central banks into junk bonds and corporate loans, this is no longer the case. It is not clear what the implications may be for substantial losses on the balance sheets of central banks, were these (very) risky assets to turn sour. To an investor’s ears, the Chines wish/curse “May you live in interesting times” has probably never sounded more ominous than today.
Footnotes
[1] Evans and Honkapohja (2009); Evans, Honkapohja and Williams (2009); Hamilton (2017); Hodrick and Prescott (1981); Wolf, Mokinski and Scheuler (2020).
References
Evans G W, Honkapohja S, Williams N, (2009), Generalized Stochastic Gradient Learning, International Economic Review, 51, 237-262
Hamilton J D, (2107), Why You Should Never Use the Hodrick-Prescott Filter, The Review of Economics and Statistics, 100, 5, 831-843
Hodrick R, Prescott E, (1981), Postwar U.S. business cycles: An empirical investigation, Journal of Money, Credit and Banking, 29, 1–16
Mullaby S, (2020), The Age of Magic Money, Foreign Affairs, July-August 2020, 65-77
Wolf E, Mokinski F, Schueler Y, (2020), On Adjusting the Hodrick-Prescott Filter, discussion paper, Deutsche Bundesbank, no 11/2020

