
Look up! A market measure of the long-term transition risks in equity portfolios
By Vincent Bouchet, ESG Director, Scientific Portfolio (EDHEC venture); Benoit Vaucher, Head of Research, Scientific Portfolio; Benjamin Herzog, Director, Scientific Portfolio
- We propose a transition factor that captures both the sectoral and intra-sectoral dimension of the transition to a low-carbon economy by relying on the climate-policy relevant sector classification and on GHG emissions intensity.
- We present an approach that enables us to disentangle the risk attributed to financial risk from those stemming from climate transition risks.
- Over the recent period (2017-2020), this risk associated with the climate transition factor already represents a significant part of the active risk of some funds.
Through the Paris agreement, the international community has committed to keep global average warming below 2℃, along with a more ambitious objective of 1.5℃. In addition to the physical effects of climate change, the economic transformations required to reach this objective will affect (positively or negatively) certain business sectors more than others (IPCC, 2022). These transformations will generate new transition risks. From an investor perspective, it is therefore essential to identify the companies that have best anticipated the regulatory, technological and market developments to avoid financial and reputational risks linked to drops in revenue, increases in costs or depreciation of (stranded) assets.
Transition risks are difficult to estimate using fundamental approaches. First, despite reinforced regulatory requirements[1] and recommendations[2], persistent gaps in climate-related data remain (NGFS, 2022). Secondly, the radical uncertainties associated with transition scenarios are difficult to incorporate into fundamental valuation models (Bolton et al., 2020). As a result, transition risk metrics display a significant degree of diversity (Bingler, Senni & Monnin, 2021).
Against this backdrop, academics have sought to measure transition risks directly from market prices. This approach relies on the ability of markets to process information in real-time, which reduces the data and model barriers mentioned above. So far, the effort has focused on building climate transition (CT) factors. These factors are designed on the same principle as traditional factors (e.g., size, value): they are portfolios constructed in such a way that their price changes are representative of the dynamics of the stocks affected by the transition risks.
The methodology we present aims to contribute to this literature on price-based analysis of transition risks by addressing two main conceptual issues. The first one is related to the design of a CT factor. While some papers rely solely on carbon intensity, i.e., the greenhouse gas (GHG) emissions of a company divided by its revenues, others use up to ten metrics to build their representative portfolio (Görgen et al., 2020). The type and number of metrics raises questions regarding their current availability, quality, and their relevance to assess long-term transition risks. Our approach departs from previous attempt at producing a CT factor based solely on individual company characteristics. Instead, we utilize what is likely to be the most robust information regarding a company’s exposure to transition risks: its industrial sector. We introduce a new CT factor that relies on i) the climate-policy relevant industrial sectors (CPRS) classification developed by Battiston et al. (2017), and ii) the carbon intensity to differentiate companies within these CPRS sectors.
The second issue of price-based analysis of transition risks is related to the use of a CT factor in a risk model. Investors have started considering transition risks relatively recently: 2015 was a pivotal year with the Paris Agreement and the warning by Bank of England Governor Mark Carney (Carney, 2015). Because the traditional tests to validate the relevance of a factor rely on long timeframes, CT factors usually do not pass these tests and are therefore not qualified as “proper” risk factors (Amenc, Esakia & Goltz, 2021; Görgen et al., 2020). We propose a different approach, one that focuses on the practical management of transition risks by disentangling the links between a portfolio’s exposure to the CT factor and the traditional ones.
Our goal is to give priority to the long-term robustness and to avoid the “Don’t Look-Up” syndrome. In this movie, the discovery of a world-killing comet serves as a metaphor for the (lack of) reaction of our society to climate change. What if this comet was not going to destroy the world, but just a single city? How would you design a “comet” factor? As in the first part of the movie, while the comet’s trajectory is known only to scientists, the effect on market prices will be negligible. However, this effect will increase dramatically once the public becomes aware of the comet’s trajectory and believes it to be true. The risk is therefore real, but its impact on prices is not observable for a long time; testing the validity of such a “comet” factor on historical prices is not relevant. In this case, the factor validation should focus on the inclusion of the most robust information about the comet: where it will crash. Therefore, we believe that the use of industrial sectors in the construction of a CT factor is crucial.
1.From a Fundamental to A Market Measure of Transition Risks
Since 2015, several articles have investigated how transition risks are already reflected in asset prices (Giese, Nagy & Rauis, 2021). Early studies focused on firms’ fundamental data as indicators of transition risks, but poor data quality as well as short analysis timeframes have limited their conclusiveness. For example, Bolton & Kacperczyk (2021) analyze 3 421 US firms over the period 2015-2017. They show that firms with higher GHG emissions and changes in GHG emissions are valued at a discount, suggesting that investors demand compensation for their exposure to transition risks (consistent with Görgen et al. 2020). Engle et al. (2020) also note that stocks of firms with lower E-Scores – which the authors argue capture higher exposure to transition risks – generate lower returns during periods with negative news about the future path of climate change, suggesting that investors reassess the compensation required to hold “brown” stocks when new information related to climate change is released.
The limitations of the fundamental measures of transition risks encouraged academics to turn to the price signal from companies with similar transition risk profiles (market measure). The main advantage of prices over characteristics is that they integrate information that has been processed by market participants. Whereas scores and characteristics are based on sub-optimal data and ad-hoc models, prices reflect the opinion of market participants who process information from a wide variety of sources. Prices thus have a richer informational content that is, moreover, updated in real-time.
However, studies based on a market measure of transition risks are also inconclusive with respect to the existence of “green” or “brown” premium. For example, In, Park & Monk (2017) build a carbon efficient-minus-inefficient (EMI) portfolio based on GHG emissions intensity within each of the 11 GICS sectors. They find positive alphas for the EMI portfolio that cannot be explained by the Fama-French five factor model (between 2010 and 2015, alpha amounts to 3.5–5.4% for EMI on the US market). Gurvich & Creamer (2022) find similar results on a broader sample (MSCI ACWI). On the other hand, the existence of this “green” premium is disputed by Alessi et al. (2021) and Amenc, Esakia & Goltz (2021) who find that the “green” premium disappears entirely when accounting for estimation error. These results are consistent with Görgen et al. (2020) who do not find significant contribution of a CT factor.
Just like Roncalli et al. (2021), our approach is less concerned with the existence of a premium than by the impact of the CT factor on risk. A price-based approach is therefore the most appropriate, as risk estimates based on prices allow a direct comparison with traditional factors.
2.A Sector-Based Climate-Transition Factor
A CT factor is meant to capture the exposure of a portfolio to the energy transition by constructing a signal that is positively correlated to companies that might suffer from an abrupt transition, and negatively correlated to companies that might benefit from this transition.
The energy transition has both a sectoral and a company-specific dimension. First, the extent of the transformations brought by the transition depends on the sectors, as the abatement cost of GHG emissions is directly related to the sector technologies (IPCC, 2022). Sector treatment in the construction of the CT factor is therefore a major concern. On the one hand, energy transition cannot be expected to wipe out entire branches of the economy, which argues in favour of a sector-neutral approach. On the other hand, some sectors will be affected more than others by the energy transition. In order to address both concerns, we design our factor as follows.
First, we narrow down the investment universe[3] to climate-policy relevant sectors (CPRS) as defined by Battiston et al. (2017). This classification identifies sectors whose primary economic activities “could be affected, either positively or negatively in a disorderly low-carbon transition [...] considering (i) the direct and indirect contribution to GHG emissions; (ii) their relevance for climate policy implementation [...] (iii) their role in the energy value chain” and has been used by several financial regulators to assess the exposure of financial institutions to transition risks (ECB, 2021; EIOPA, 2018). This first source of information for the design of our CT factor is both robust (the sectoral affiliation is easily accessible) and forward-looking (the classification is established on the basis of disorderly transition scenarios).
The second step is to identify companies within these sectors that may benefit (or suffer) from a disorderly transition in the long run. Ideally, this step would be carried out on the basis of multiple company climate-related data. For example, Görgen et al. (2020) compute a “Brown Green Score” from 10 variables containing company specific information related to value chain, adaptability and public perception. However, these data remain scarce and are not available for all sectors (NGFS, 2022). Moreover, Roncalli et al. (2020) showed that the composite indicator built by Görgen et al. (2020) is well captured by a factor based on the GHG-emissions intensity only. We therefore consider GHG emissions intensity as a robust and still relevant metric for identifying companies exposed to transition risks within the climate-policy relevant sectors.
This brings up the question of the scope of the emissions to be considered. The objective of our factor is to capture a market signal that is expected to evolve as new information becomes available, in particular when companies’ greenhouse gas emissions are updated. It is therefore important that the granular design of the CT factor is based on consistent data regardless of the data provider used by market participants. By comparing seven data providers, Busch, Johnson & Pioch (2020) highlighted strong inconsistencies in indirect (Scope 3) data, whether reported by companies or estimated by external parties. To be as robust as possible, our CT is therefore only built on the GHG emissions intensity on the direct (Scope 1) and energy consumption (Scope 2) perimeters, for which there are higher levels of data consistency. Not explicitly taking into account Scope 3 emissions is also consistent with our sectoral approach. As pointed out by Ducoulombier (2021), reporting standards are not intended to support comparisons between firms, and estimates take insufficient consideration of firm-level circumstances to support intra-sector comparisons. Therefore, a company’s Scope 3 emissions data (currently available) is essentially linked to its sector. This information is already taken into account in our factor by the CPRS classification.
Finally, our CT factor is constructed as follows: the long (“brown”) leg is built as an equally weighed (EW) portfolio of the 50% most GHG emissions intensive stocks selected within each of the six CPRS sectors. Similarly, the short (“green”) leg is built as an EW portfolio of the 50% least GHG emissions intensive stocks selected within each of the six CPRS sectors. Then, the weight of each leg is set so that the factor is market neutral. In this way, we assume that the CT factor should not contain any market risk. This approach is consistent in the context of asset management, where the market serves as a benchmark for risk.
3.Climate Transition Factor Consistency
Identifying the ability of a factor to capture the sensitivity of a portfolio to the energy transition is difficult because we have not experienced energy transition episodes of sufficient magnitude in the past to test such a factor. For example, the maximum carbon price observed on the EU-ETS market before 2020 was EUR30, while the average global carbon price associated with ambitious decarbonization scenarios reaches several hundred dollars. The robustness of the CT factor should therefore be assessed on its design more than on its statistical power. To do so, we compare three candidate factors: a) the climate-transition factor (CT) described above, a sector-relative intensity factor based on a traditional sectoral classification (IOS), and an intensity-only factor (IO). The IOS factor is based on the GHG emissions intensity relative to its Refinitiv Business Classification (TRBC) sector (at the first level, i.e., 10 sectors) while the IO factor is built on a long-short strategy based on the GHG emissions intensity only.
A first test to assess the robustness of these factors is to compare their composition. Since the objective is to construct a signal centred on transition risks, it is important that this composition be representative of companies sensitive to the transition: the various sectors concerned should be represented, and both “green” and “brown” activities should be included. The composition of each factor shows that considering only carbon intensity leads to large weights outside of climate-sensitive sectors (Figure 1).
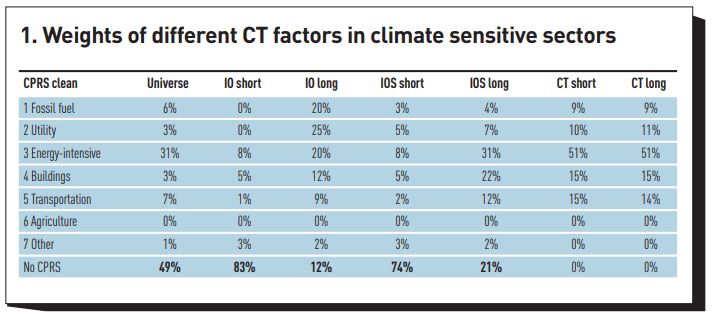
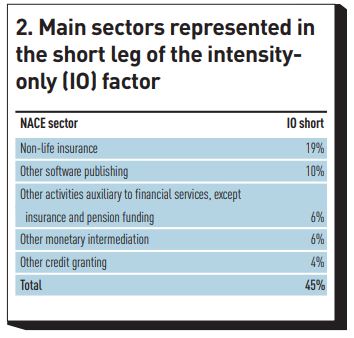
Indeed, in the considered universe (US), 49% of the stocks are not considered to be climate policy relevant according to the CPRS classification. In the IO factor, while the long leg contains mostly CPRS stocks, the short leg contains less than 20% of CPRS stocks (26% for the short leg of the IOS factor). In the future, the signal from these factors will therefore be driven mainly by companies with little concern for transition risks while companies that might benefit from the transition (best-in-class within the CPRS sectors) will remain out of scope. For example, the five NACE[4] sectors most represented in the short leg of the IO factor are financial and IT sectors, which are not directly concerned by the energy transition (Figure 2). This holding-based analysis thus shows the importance of restricting the construction of factors to the CPRS universe to target where the transition risks are likely to occur.
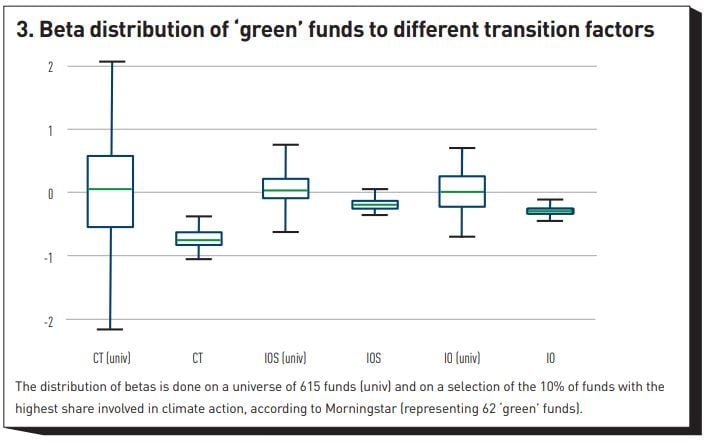
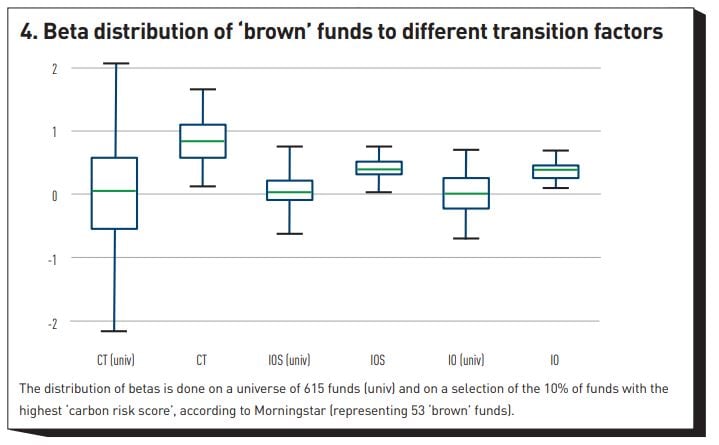
While the first goal of the CT factor is to capture sensitivity to the long-term transition, such a factor should already allow the identification of funds considered as “green” or “brown”. A second test then consists of measuring the extent to which the sensitivity of a fund to the various factors is consistent with its current “green” or “brown” characteristic (estimated by a third party). Since there is no homogeneous definition of such funds, we consider a sample of “green” funds as the top decile of funds of our universe[5] based on the average share of corporate revenues that contribute positively to the climate mitigation (data from Morningstar). Conversely, we define a sample of brown funds as those with the highest transition risk score (as defined by Morningstar). We show that the betas of the “green” (respectively “brown”) funds to the CT factor are significantly lower (respectively higher) than the average betas of the funds of our universe (Figures 3 and 4). This confirms the ability of the CT factor to identify “green” and “brown” funds from their prices. When considering correlation instead of betas, we find that the CT factor has higher correlations to green funds than the IO and IOS factors.
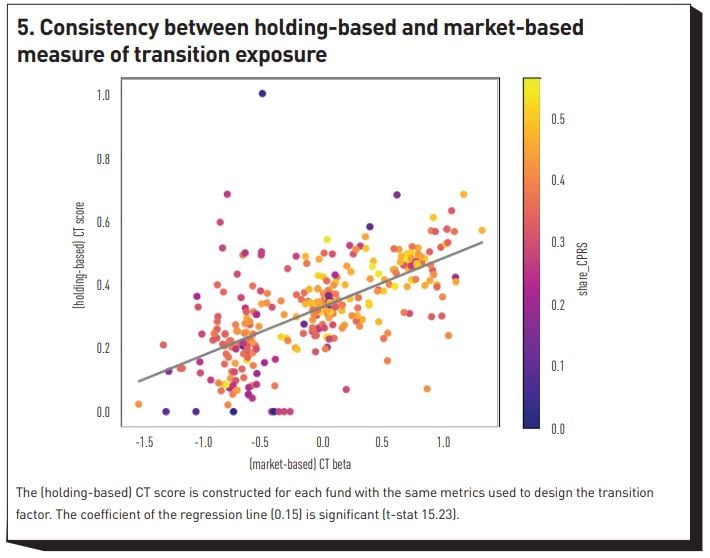
A final test is to check the consistency between our market-based approach and a holding-based approach built on the same metrics as those used to design the CT factor. On the one hand, it is important to ensure consistency between these two approaches, which have the same ultimate objective: to measure the sensitivity of a portfolio to the energy transition. On the other hand, the use of a price signal is motivated by the fact that it can indirectly integrate more information than a holding-based score, which can therefore explain the different results between the two approaches. To do this, we regress a holding-based risk metric constructed for each fund as the weighted share of constituents with carbon intensity above the median carbon intensity of their related CPRS main sector (only considering CPRS weights) against the beta of the fund to the CT factor. The coefficient is positive and significant, which confirms the consistency of the market-based approach. Several reasons can explain the remaining different results between the two approaches. First, we observe that the outliers are essentially funds where the share of securities belonging to the CPRS sectors is low (Figure 5) and where transition risks are therefore not a priority concern. Moreover, the market-based approach is based on prices, which represent a large amount of information “digested” by market participants and can therefore capture more information than sector and carbon intensity. Two companies with the same carbon intensity and belonging to the same sector may indeed be impacted differently by the energy transition, for example if the regulations applicable in their respective countries of activity differ (presence or absence of carbon taxes) or if one of them has been the subject of climate change controversy. A market-based approach captures these kinds of differences, whereas a holding-based approach only focuses on a small number of transition-related metrics.
4.Disentangling Climate Transition Risks from Traditional Risks
In its simplest form, the price-based transition risks correspond to the volatility that is due to an exposure to the CT factor:
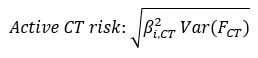
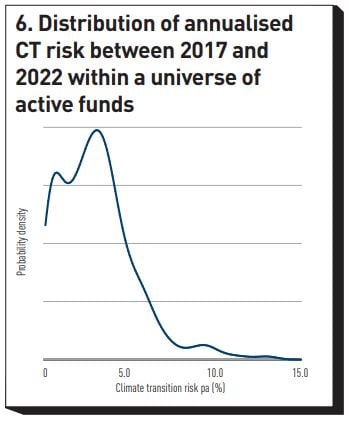
Here  corresponds to the exposure of an instrument to the CT factor. Because the CT factor is market neutral, this risk does not include any market risk, hence the “active” denomination. As detailed in Vaucher, Bouchet & Herzog (forthcoming), this definition enables the management of climate-transition risks via portfolio optimization. The (absolute) annualised contribution of the CT factor of our sample of 1361 active US funds and ETFs is shown in Figure 6. On average, this contribution represents 30% of the total active risk in these funds.
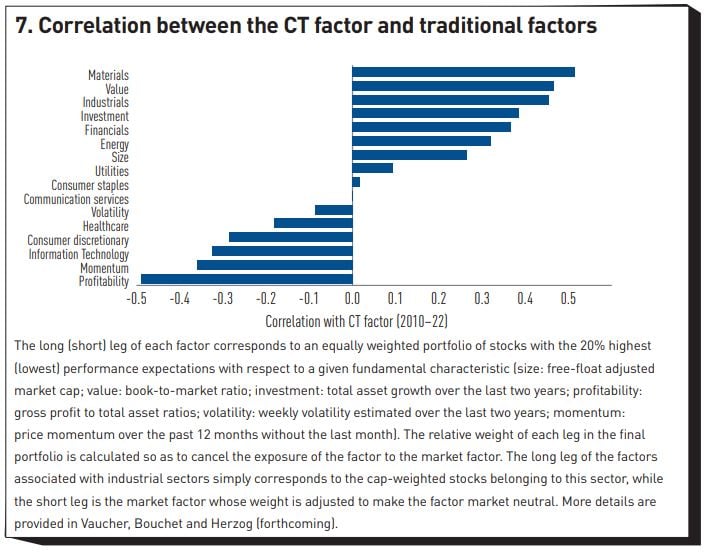
Much of the contribution of the CT factor can be traced back to the correlations between the CT and traditional factors (Figure 7). Notably, the CT factor exhibits important correlations to the sectoral factors “Industrials” and “Materials”, and to the “Value” and “Investment” factors. Although our factor is designed as a long-short factor within transition sensitive sectors, the two sectoral biases “Industrials” and “Materials” can be explained by the fact that these two sectors (GICS) are grouped within the same “Energy intensive” sector in the CPRS classification. This relationship suggests that a portfolio optimization aiming at reducing the CT factor exposure will also tend to reduce the exposure of the portfolio to these factors if it is performed without controlling for factor exposures.
However, Vaucher, Bouchet & Herzog (forthcoming) show that the portfolios obtained by seeking to reduce the portfolio exposure to the IO factor will differ from the portfolios seeking to reduce the exposure to the CT factor. Because the carbon intensity is heavily correlated to the Oil and Coal sectors, reducing exposure to the IO factor will lead to divestments concentrated in these sectors, as well as investments in the retail and IT sectors. On the other hand, reducing exposure to the CT factor is obtained by performing divestments in a more diverse set of sectors including Mining, steel production, Shipping, Agriculture, while moving relatively less capital to the IT sector.
5.Conclusion
To overcome the climate-related data gaps and to take advantage of the ability of market participants to integrate broader information in asset valuation, we propose a market-based measure of transition risks. In order to avoid the “Don’t look up” effect associated with validating a factor only from a historical perspective, we focus on the design of a relevant and robust climate-transition (CT) factor sensitive to the long-term energy transition shocks.
We propose a CT factor that captures both the sectoral and intra-sectoral dimensions of transition risks by relying on the climate-policy relevant sectors classification (Battiston et al., 2017) and on GHG emissions intensity. By construction, this leads to a reduction in the eligible universe of 50%, and thus avoids the factor signal being disrupted by companies little affected (negatively or positively) by transition risks, as opposed to a factor based solely on the GHG emissions intensity. While the main goal of our CT factor is to be forward-looking, we show that this factor is already able to efficiently identify funds considered as “green” or “brown”.
We also highlight that exposure to certain traditional factors such as “Value” and “Investment” are associated with greater transition risk. Without control, reducing exposure to transition risks may therefore lead to undesirable biases on other factors.
Our market-based approach of transition risks allows the practical management of transition risks via portfolio optimisation. As detailed in Vaucher, Bouchet & Herzog (forthcoming), these techniques are straight-forward to implement as they only require already existing sets of financial factors. Climate transition risks are not only measurable, but they are also manageable with the same tools as those used to manage financial risks.
One of the major avenues for future research would be transposing this methodology to other complex environmental issues such as biodiversity, where important data gaps remain but where the recent development of specific indicators would permit such a factor to be built.
Footnotes
[1] E.g., with the EU corporate sustainability reporting directive or taxonomy regulation.
[2] E.g., from the task force on climate-related financial disclosures (TCFD).
[3] Our universe consists of the 500 largest companies in the US market.
[4] The Statistical Classification of Economic Activities in the European Community (see https://ec.europa.eu/eurostat/web/nace-rev2/overview).
[5] Our fund universe consists of 600 funds and ETFs offered in the US market.
References
Alessi, L., E. Ossola and R. Panzica (2021). What greenium matters in the stock market? The role of greenhouse gas emissions and environmental disclosures. Journal of Financial Stability 54, 100869.
Amenc, N, M. Esakia and F. Goltz (2021). When Greenness is mistaken for alpha, Scientific Beta white paper, May. Available here: https://www.scientificbeta.com/factor/#/documentation/latest-publication...
Battiston, S., A. Mandel, I. Monasterolo, F. Schütze and G. Visentin (2017). A climate stress-test of the financial system. Nature Climate Change 7(4): 283-288.
Bingler, J.A., C. Senni and P. Monnin (2021). Climate Transition Risk Metrics: Understanding Convergence and Divergence across Firms and Providers. Available at SSRN 3923330.
Bolton, P., M. Després, L.A. Pereira da Silva, F. Samama and R. Svartzman (2020). The green swan. BIS Books, Bank for International Settlements, Number 31.
Bolton, P., and M. Kacperczyk (2021). Do investors care about carbon risk? Journal of Financial Economics 142(2) 517-549.
Busch, T., M. Johnson and T. Pioch (2022). Corporate carbon performance data: Quo vadis? Journal of Industrial Ecology 26(1): 350-363.
Carney, M. (2015). Breaking the Tragedy of the Horizon – Climate change and financial stability. Speech given at Lloyd’s of London.
Ducoulombier, F. (2021). Understanding the importance of Scope 3 emissions and the implications of data limitations. The Journal of Impact and ESG Investing 1(4) 63-71.
ECB (2021). Climate-related risk and financial stability. European Central Bank.
EIOPA (2018). Financial Stability Report. European Insurance et Occupational Pensions Authority.
Engle, R.F., S. Giglio, B. Kelly, H. Lee and J. Stroebel, J. (2020). Hedging climate change news. The Review of Financial Studies 33(3): 1184-1216.
Giese, G., Z. Nagy and B. Rauis. (2021). Foundations of Climate Investing: How Equity Markets Have Priced Climate-Transition Risks. The Journal of Portfolio Management 47(9): 35-53.
Görgen, M., A. Jacob, M. Nerlinger, R. Riordan, M. Rohleder and M. Wilkens (2020). Carbon Risk Available at: https://ssrn.com/abstract=2930897 or http://dx.doi.org/10.2139/ssrn.2930897
Gurvich, A., and G.G. Creamer (2022). Carbon risk factor framework. The Journal of Portfolio Management 48(10): 148-164.
In, S.Y., K.Y. Park and A. Monk (2017). Is “Being Green” Rewarded in the Market? An Empirical Investigation of Decarbonization Risk and Stock Returns. International Association for Energy Economics (Singapore Issue) 46(48).
IPCC (2022) Climate Change 2022: Mitigation of Climate Change. Contribution of Working Group III to the Sixth Assessment Report of the Intergovernmental Panel on Climate Change [P.R. Shukla, J. Skea, R. Slade, A. Al Khourdajie, R. van Diemen, D. McCollum, M. Pathak, S. Some, P. Vyas, R. Fradera, M. Belkacemi, A. Hasija, G. Lisboa, S. Luz, J. Malley, (eds.)]. Cambridge University Press, Cambridge, UK and New York, NY, US.
NGFS (2022). Final report on bridging data gaps. Network for Greening the Financial System.
Roncalli, T., T. Le Guenedal, F. Lepetit and T. Sekine (2020). Measuring and Managing Carbon Risk in Investment Portfolios. Available at SSRN 3681266.
Roncalli, T., T. Le Guenedal, F. Lepetit and T. Sekine (2021). The Market Measure of Carbon Risk and its Impact on the Minimum Variance Portfolio. The Journal of Portfolio Management 47(9): 54-68.
Vaucher, B., V. Bouchet and B. Herzog (Forthcoming). Look up! A market-measure of the long-term transition risks in equity portfolios. Working Paper. Scientific Portfolio.
Rubrique
About EDHEC
Operating from campuses in Lille, Nice, Paris, London and Singapore, EDHEC is one of the world’s top 15 business schools. Fully international and directly connected to the business world, EDHEC commands a strong reputation for research excellence and the ability to train entrepreneurs and managers capable of breaking new ground. EDHEC functions as a genuine laboratory of ideas and produces innovative solutions valued by businesses. The School’s teaching is inspired by its research work and a focus on “learning by doing”, all with the aim of equipping people with the skills to succeed in business.
