Measuring and Managing ESG Risks in Sovereign Bond Portfolios
By Lionel Martellini, Director, EDHEC-Risk Institute and Lou-Salomé Vallée, Teaching Assistant, EDHEC Business School
Over the past decade, sustainable and responsible investing have gained momentum and continue to grow in popularity among investors, and it is increasingly recognized that the financial system has a particularly important role to play in the transition towards a low-carbon and climate-resilient economy.
The integration of sustainability considerations into the decision-making process for investments, as measured by Environmental, Social and Governance (ESG) indicators, has been driven by investor demands, fiduciary duty, climate change and the development of new regulations and values. Sustainability in the financial sector is becoming mainstream and is reshaping global markets.
Nevertheless, the integration of ESG factors into sovereign bond investment analysis and investment-decision making is not systematic due to a lack of understanding among investors of how to integrate ESG issues into sovereign debt analysis and a lack of consistency in defining and measuring material ESG factors. The absence of a coherent investment framework for integrating ESG indicators into sovereign bond investments is consistent with the relative scarcity of available academic research on the subject, which has focused more on ESG investing in equity markets.
In a recent paper (Martellini and Vallée, 2021, we explore the impact of ESG factors on the risk and return of sovereign bonds from an investor perspective, in particular investigating how to measure and manage EGS risks in sovereign bond portfolios and their implications for sovereign bond portfolio strategies.
Impact of ESG criteria on risk and return characteristics of sovereign bonds
We first provide an assessment of the materiality and impact of ESG scores[1]taken individually on key risk and return indicators of relevance to asset owners in both developed and emerging markets.[2] Our main goal is to analyze whether cross-sectional differences in the risk and return of sovereign bonds from various developed or emerging issuing countries can be explained partly by cross-sectional differences in E, S or G scores.
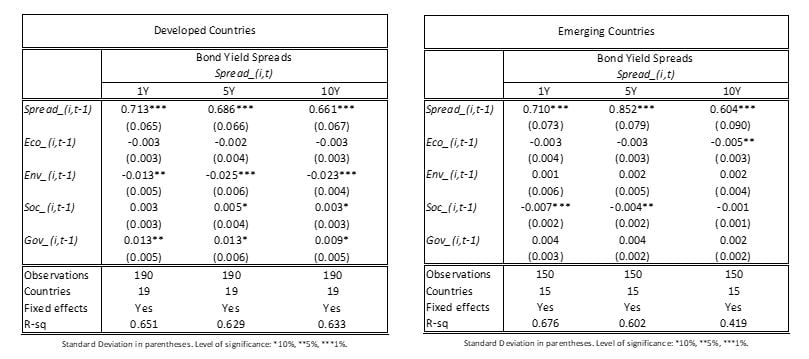
Regarding the impact of cross-sectional differences in each score (E, S, and G) on sovereign bond yield spreads, our estimation results allow us to extract two key conclusions (see Exhibit 1).
First, we find that for developed countries, after controlling for economic[3] scores and other fixed effects, the E dimension has a significant and negative impact on bond yield spread. These results mean that a higher E score is associated with a lower spread for 1-year, 5-year and 10-year bond maturity, and this impact is more pronounced in the medium run. From an issuer standpoint, better E scores can therefore lead to reduced borrowing costs, everything else being equal.
From the investor standpoint, this result suggests that a lower yield is to be expected when investing in countries with higher environmental performance, which tells us that a negative premium is associated with this reduction in environmental risk.
On the other hand, for emerging countries, after controlling for economic scores and other fixed effects, we find that the S dimension has a significant and negative impact on bond yield spread, meaning that a higher S score is associated with a lower spread for 5-year and 10-year bond maturity, and this impact is more pronounced in the short run. Hence, from an investor standpoint, a lower yield is to be expected when investing in countries with higher social performance, suggesting that a negative premium is associated with this reduction in social risk.
Exhibit 1: Estimation results for developed and emerging countries of the impact of E, S and G scores of sovereign bond yield spreads

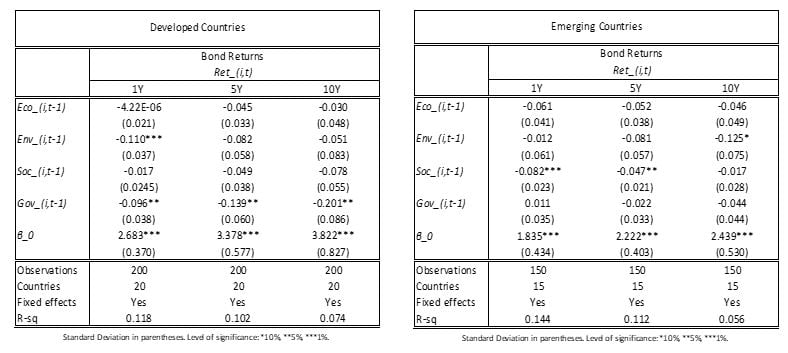
We then turn to the impact of cross-sectional differences in E, S, and G on the performance characteristics of short-term sovereign bond returns (see Exhibit 2).
We find that for developed countries, after controlling for economic scores and other fixed effects, both the E and G dimensions have a significant and negative impact on bond returns, meaning that a higher E and G score is associated with lower bond return, and the impact of the G dimension on bond returns is more pronounced in the long run.
On the other hand, for emerging countries, and also controlling for economic scores and other fixed effects, we find that the S dimension has a significant and negative impact on bond returns, meaning that a higher S score is associated with lower bond return, and the impact is more pronounced in the short run.
Exhibit 2: Estimation results for developed and emerging countries of the impact of E, S and G scores of sovereign bond returns

Implications for sovereign bond portfolio management
In the second step, we explore the portfolio implications of these findings, investigating the impact of integrating ESG criteria at the selection and portfolio construction stages. In particular, we analyze how to measure and minimize the opportunity costs associated with the introduction of ESG constraints with respect to an otherwise comparable unconstrained sovereign bond portfolio strategy. Our main goal is to investigate how implementation choices regarding how ESG criteria are incorporated into a portfolio can have a direct impact on this opportunity cost. Finally, we also explore the benefits of ESG momentum strategies, defined as strategies designed to exploit time-series differences in ESG scores, as opposed to exploiting cross-sectional differences in these scores.
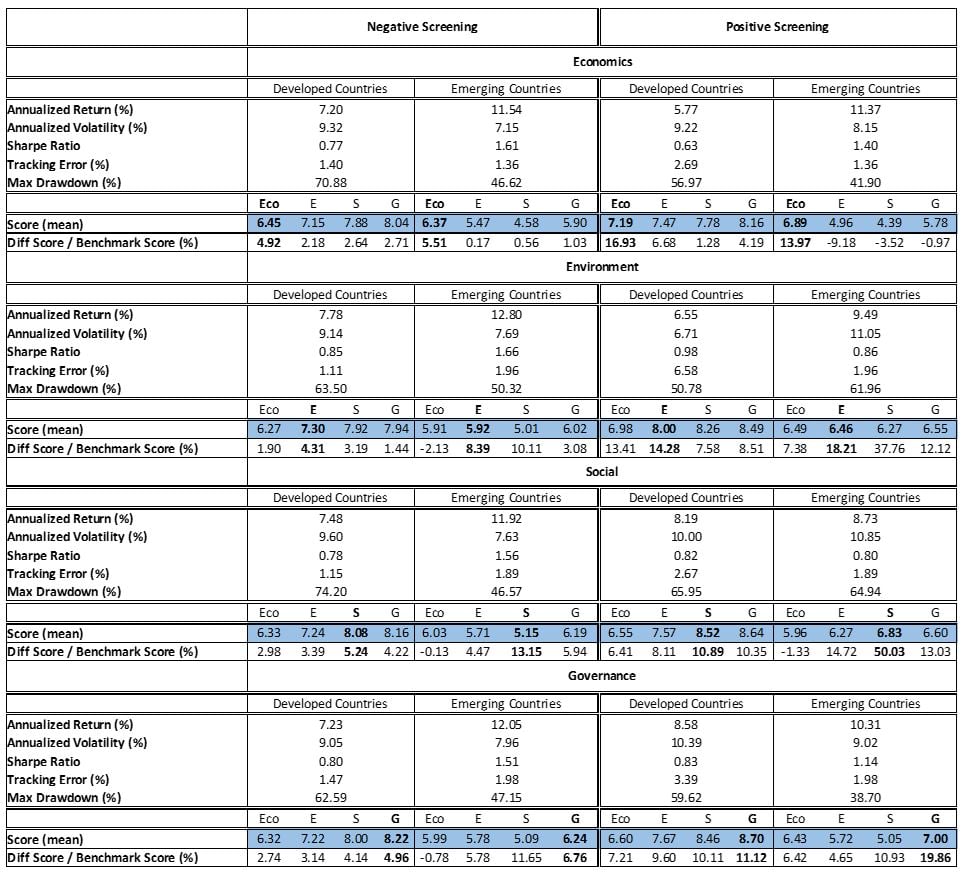
The first approach to the introduction of ESG criteria into the investment process is to include them at the selection stage. Our negative screening strategy consists of excluding the 25% lowest-ranked bonds (Q1), with the selected bonds corresponding to the 75% best-ranked bonds (Q2, Q3 and Q4). Our positive screening strategy consists of selecting the 25% best-ranked bonds (Q4). The selected bonds, for both strategies, are then equally weighted, and the portfolios are rebalanced on an annual basis.[4] We build separate portfolios of 5-year maturity sovereign bonds for developed and emerging countries (see Exhibit 4), and compare them to an equally-weighted benchmark with no selection (see Exhibit 3).
Starting with the negative screening strategy, we find that increasing the sustainability (E, S and G criteria taken separately) of a portfolio using negative screening does not lead to substantially lower returns and increases volatility by only 0.5% on average for developed countries and 0.9% for emerging countries. However, the corresponding increase in E, S and G scores remains quite limited, up to 4.8% on average for developed countries and 8.4% on average for emerging countries.
Regarding the positive screening strategy for developed countries, increasing the sustainability of a portfolio using positive screening comes at a cost for the E dimension, while it slightly enhances returns and increases volatility for the S and G dimensions. For emerging countries, increasing the sustainability of a portfolio using positive screening also comes at a clear cost since for all dimensions it implies a lower annualized return and higher volatility. The higher the increase in the score (the more sustainable a portfolio is, based on our different criteria taken individually), the higher the cost. For each dimension, we confirm that the scores are systematically higher compared to the benchmark portfolios, and also with respect to the less aggressive negative screening strategy, which makes sense since these portfolios only include the 25% best-ranked bonds.
Exhibit 3: Benchmark results over the sample period 2010–2020 for developed and emerging countries

Exhibit 4: Results of the negative and positive screening strategies over the sample period 2010–2020 for developed and emerging countries

We also investigate the impact of integrating E, S and G criteria into the optimization approach, which is to minimise the tracking error of a portfolio (see Exhibit 5). We confirm that a dedicated focus on relative risk minimisation leads to a lower increase in tracking error with respect to other selection or optimization strategies for the same target level of improvement in ESG scores.
Exhibit 5: Tracking Error (bps) of E, S and G constraint portfolios over the sample period 2010–2020 for developed and emerging countries

Finally, we explore the benefits of ESG momentum strategies (see Exhibit 8). We find that for developed countries, regardless of bond maturity, the top 15% of bonds exhibiting positive changes in E and G scores outperformed the bottom 15% on average from 2010 to 2020. Moreover, the long-short ESG momentum strategy based on the E dimension offers attractive levels of performance, substantially higher than the strategy based on changes in G scores, while for emerging countries, regardless of bond maturity, the top 15% of bonds exhibiting positive changes in S scores outperformed the bottom 15%. Regarding G, the top 15% of bonds exhibiting the highest differences in scores outperformed the bottom 15% for 1-year and 5-year bond maturity only.
These results suggest that additional value can be added by implementing portfolio decisions informed not only by cross-sectional differences in ESG scores, but also by variations in these scores over time, suggesting the presence of some form of under-reaction to news related to changes in ESG scores.
Measuring and managing the opportunity costs of ESG investing in sovereign bond markets
The integration of ESG constraints into investment decisions can be assumed to involve an opportunity cost with respect to the outcome that would be optimally achieved in the absence of ESG considerations. This opportunity cost can be measured in terms of a possible increase in risk and reduction in performance (particularly meaningful for the benchmark-free investor) and/or in terms of an increase in tracking error with respect to the benchmark (particularly meaningful for the benchmark-driven investor).
The main contribution of our analysis is that it demonstrates that several competing implementation choices exist with respect to how ESG constraints are incorporated into a sovereign bond portfolio construction context, and different choices have different impacts on these opportunity costs. In particular, we find that higher Environment scores for developed countries and higher Social scores for emerging countries are associated with lower costs of borrowing for issuers and consequently with lower yields for investors. We also confirm that negative screening leads to more diversified portfolios and lower levels of tracking error, while positive screening leads to higher levels of improvement of ESG scores, at the cost of an increase in absolute and relative risk budgets. In an attempt to alleviate some of these concerns, we find that a dedicated focus on absolute or relative risk reduction at the selection stage allows investors to reduce the opportunity costs along the dimension that is most important to them. Finally, we provide evidence that ESG momentum strategies in sovereign bond markets can be used to further reduce some of the aforementioned opportunity costs.
Overall, our results suggest that sound risk management practices are critically important in allowing investors to incorporate ESG constraints into their investment decisions at an acceptable cost in terms of dollar or risk budgets.

The research from which this article was drawn was produced as part of the Amundi ETF, Indexing and Smart Beta Investment Strategies research chair at EDHEC-Risk Institute.
A copy of the publication can be downloaded via the following link: EDHEC-Risk Institute Publication: Measuring and Managing ESG Risks in Sovereign Bond Portfolios and Implications for Sovereign Debt Investing
Footnotes
[1] We use the Verisk Maplecroft database for ESG indicators.
[2] Our sample comprises annual observations for 20 developed countries, of which the US will be used as the reference country when a risk-free rate is needed, as well as 15 emerging countries from 2010 to 2020, resulting respectively in 200 observations for developed countries and 150 observations for emerging countries.
[3] We prefer to use the Verisk Maplecroft Economics index rather than credit ratings, since credit rating agencies might already incorporate ESG criteria into their analyses.
[4] Consistent with the fact that Verisk scores are updated on an annual basis.

