
Measuring the carbon emissions of infrastructure assets: the case of airports and beyond
By Fabien Nugier, Senior Research Engineer, EDHECinfra; Darwin Marcelo, Project Director, EDHECinfra; Amanda Wee, Analyst, EDHECinfra
As the demand for data on climate risks increases for investors in real assets, EDHECinfra is developing a global data collection and carbon dioxide (CO2) emission estimation exercise across the asset class.
The continued increase in the concentration of atmospheric CO2 and the creation of regulations to limit carbon emissions create risks for investors in infrastructure assets. Transition risks are magnified by the long lifespan of these investments and must take an everincreasing role in investment decisions. The management of such risks calls for accurate emission predictions but directly reported data is often lacking for these assets, predominantly due to their private ownership.
EDHECinfra has developed a systematic approach to estimate transition risks across all infrastructure assets. This approach:
- uses CO2 emissions as a proxy for transition risks;
- employs a common analytical framework to model emissions as functions of location-dependent variables (climate, elevation, etc), structural variables (dimensions, areas, etc) and capacity indicators;
- applies that framework to the specificities of each asset type; and
- extracts the most relevant metrics for investors.
Since it is common usage, we make a distinction among metrics according to their scopes:
- Scope 1: direct emissions from stationary or mobile combustions, fugitive emissions;
- Scope 2: indirect emissions from purchased electricity, heat and steam; and
- Scope 3: other indirect emissions from sources not owned by the infrastructure, such as upstream or downstream purchases of goods and services, business travel, commute of employees and users, transportation, etc.
In what follows, we show an application of this approach to airport infrastructures which represented 12% of global transport emissions in 2019, have highly regulated activities and relatively good data coverage. Despite important reductions of emissions per passenger, the constant increase in air transport demand (only recently impacted by the COVID-19 pandemic) has brought increasing pressure on airports to reduce their emissions.
Airports’ Scope 1 and 2 emissions
Airports come in different sizes and shapes as we consider them around the globe. However, due to their interdependence and reliance on the same aircrafts, operating airlines, and regulations, airports also share common characteristics. It is fair to assume that a limited set of parameters is sufficient to understand their emissions. These parameters are often the numerical quantities reported in sustainability reports.
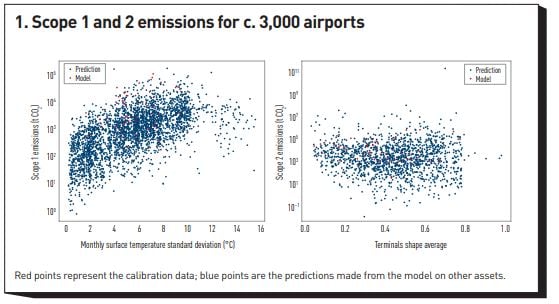
We model Scopes 1 and 2 based on the current literature and the factors that are the most relevant for direct emissions and electricity consumption: patronage, local temperature, geospatial characteristics, airport-owned power plants and air traffic. Such data was gathered with the highest possible coverage of features for several thousand airports and served as the basis for modelling.
Relying on publicly disclosed sustainability reports, it is possible to relate real scope emissions to the above regressors on a reduced set of airports and evaluate the most important factors explaining their emissions. For that, a statistical approach covering multiple combinations of regressors was implemented to find the best linear regressions as well as minimising explanatory factors. The models for Scopes 1 and 2 metrics that resulted from this approach were then used to predict emissions of airports which are not known or publicly reported, based on the same set of best-fit regressors.
Figure 1 shows Scopes 1 and 2 emissions against one of their most relevant regressors (assessed from their p-value). Current Scope 1 and 2 models can explain half of the variance of observed emissions. K-fold cross-validation was applied to confirm predictability and these models were then employed to predict Scope 1 and 2 respectively for several thousand airports across the globe.
Thus, using a set of observable airport characteristics, we can predict the Scope 1 and 2 emissions of thousands of airports globally and build robust rankings of the carbon performance of individual airports by comparing them to thousands of cases in the cross-section. This is an important improvement to existing rankings which rely on too little data to be robust: using only available reported and contributed data, it is not possible to tell which asset is more exposed than others. Our approach creates thousands of estimates calibrated from actual asset-level data and allows investors to begin to understand how exposed they are to transition risk.
Airports’ Scope 3 emissions
In general, airport owners limit the reporting of Scope 3 emissions to their landing and take-off cycle (LTO) operations, ground support equipment or tenants’ activities such as heating, electricity purchase and vehicles usage. To the authors’ knowledge, Heathrow airport is the only one reporting departure cruise emissions. This diversity of emission sources and the lack of directly reported data makes the estimate of Scope 3 more involved than Scopes 1 and 2.
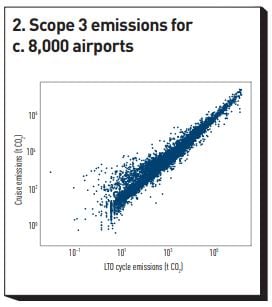
Nevertheless, the use of air traffic data allows the estimate of LTO emissions, which often dominates Scope 3 (although passengers’ and employees’ commutes can also be significant), and further allows the estimate of cruise emissions, almost never reported. After these two effects are captured, other sources of Scope 3 can be seen as next-order corrections. Based on these considerations, several models were developed by EDHECinfra, among them a distance-based model of cruise and a time-based estimate of LTO emissions at aircraft levels. In this setting, sustainability reports have brought precious information to validate yearly metrics and calibrate higher frequency metrics.
As shown in figure 2, cruise and LTO emissions were estimated for more than 8,000 airports. Based on these estimates, we can see that LTO emissions represent on average ~26% of the departure cruise emissions. This number varies significantly between airports, as visible through the dispersion in the plot. Numerous derived metrics relevant for investors’ decisions can be extracted from these high frequency estimates, such as emissions by countries or by airline companies, emissions per passengers or revenues, etc.
Towards transition risk rankings for all infrastructure assets
Based on physical and operational characteristics of infrastructures, EDHECinfra data can palliate the lack of emission reporting. Figure 3 shows the distribution of estimated emissions for thousands of airports and allows ranking not only these assets but any asset for which investors have emission estimates (at least for Scopes 1 and 2).
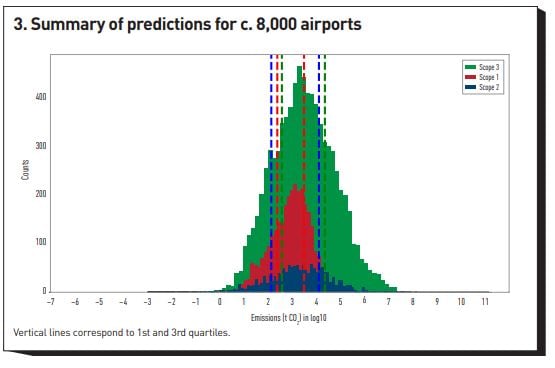
This approach provides a systematic and reliable assessment of transition risks and satisfies the need of infrastructure investors for consistent metrics across countries and asset types.
Footnotes
- Air Transport Action Group. Facts & Figures. https://www.atag.org/facts-figures.html
- Ahn, Jognhoon, and Soolyeon Cho (2015). Energy Performance Benchmark Model for Airport Terminal Buildings. Proceedings of BS2015: 14th Conference of International Building Performance Simulation Association, Hyderabad, India, 7-9 December
- Bo Li, Wen Zhang, Jianping Wang, Junku Xu and Jixiang Su (2017). Research and Analysis on Energy Consumption Features of Civil Airports. IOP Conference Series: Earth and Environmental Science, Volume 94, Third International Conference on Energy, Environment and Materials Science (EEMS 2017) 28–30 July 2017, Singapore.
- Kang ,Minkyung, Mario Bergés and Burcu Akinci (2017). Forecasting Airport Building Electricity Demand on the Basis of Flight Schedule Information for Demand Response Applications. Transportation Research Record: Journal of the Transportation Research Board 2603(1).
- Gu, Xianliang, Jingchao Xie, Zhiwen Luo and Jiaping Liu (2021). Analysis to energy consumption characteristics and influencing factors of terminal building based on airport operating data. Sustainable Energy Technologies and Assessments 44. 101034. ISSN 2213-1388.
- Kim, Sang-Chul, Hyun-Ik Shin and Jonghoon Ahn (2020). Energy performance analysis of airport terminal buildings by use of architectural, operational information and benchmark metrics. Journal of Air Transport Management 83: March. 101762.
Rubrique
About EDHEC
Operating from campuses in Lille, Nice, Paris, London and Singapore, EDHEC is one of the world’s top 15 business schools. Fully international and directly connected to the business world, EDHEC commands a strong reputation for research excellence and the ability to train entrepreneurs and managers capable of breaking new ground. EDHEC functions as a genuine laboratory of ideas and produces innovative solutions valued by businesses. The School’s teaching is inspired by its research work and a focus on “learning by doing”, all with the aim of equipping people with the skills to succeed in business.
