
Measuring Volatility Pumping Benefits in Equity Markets
by Jean-Michel Maeso, Senior Quantitative Research Engineer, EDHEC-Risk Institute
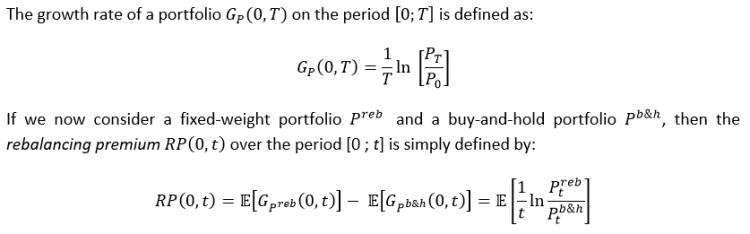
It has been argued that portfolio rebalancing, defined as the simple act of resetting portfolio weights back to the original weights, can be a source of additional performance. This additional performance is known as the rebalancing premium, also sometimes referred as the volatility pumping effect or diversification bonus since volatility and diversification turn out to be key components of the rebalancing premium. The rebalancing premium, intrinsically linked to long-term investing, is typically defined as the difference between the expected growth rate of a rebalancing strategy and the expected growth rate of the corresponding buy-and-hold strategy, where the portfolio growth rate is the compounded geometric mean return of the portfolio, a meaningful measure of performance in a multi-period setting.
Empirical Analysis of the Rebalancing Premium
The base universe of our empirical study consists of the 132 stocks extracted from CRSP which have continuously been in the S&P 500 index from November 1985 to December 2015. While this obviously implies the presence of a survivorship bias in equity portfolio performance, there is no reason to assume that it will impact the main comparative results of our analysis. We use a resampling procedure and build one set of 30 randomly selected equally-weighted portfolios and another set with the 30 randomly selected corresponding buy-and-hold portfolios. Then we average the (historical) rebalancing premium for the two sets of 30 random sets of portfolios. More precisely, the rebalancing premium that we use to compare the rebalanced portfolios with the buy-and-hold portfolios is reported in this setting as the average of the rebalancing premium over the 30 random portfolios. This particular procedure mitigates the impact of stock selection biases. We consider the following set of values for the number of stocks in each randomly selected universe: 2, 10, 30, 50 and 132. In the case where we take N = 132, which is equal to the total size of the universe under analysis, we of course obtain a single portfolio, as opposed to 30 different portfolios.
We make the following assumptions: (i) the initial weight invested in each asset is = 1/ N and (ii) the rebalancing frequency is 1 month. Firstly, we focus in Figure 1 on the historical rebalancing premium as a function of time horizon (ranging from 1 month to 30 years) for different numbers of stocks in the portfolios. For a 5-year time horizon and a number N = 30, the historical rebalancing premium is reasonably high at 85 bps. In a different configuration, with a 10-year time horizon and N = 50 risky assets, the historical rebalancing premium is 113 bps. We assess that the number of stocks considered has almost no influence as long as it exceeds a minimum value around 10. This first perspective shows that the historical rebalancing premium from our S&P 500 base universe is higher than 50 bps if the number of stocks N is higher than or equal to 2 and time horizon is at least 5 years. If we take the number of stocks N higher than or equal to 10, then the historical rebalancing premium is higher than 50 bps for time horizons higher than or equal to 2 years.
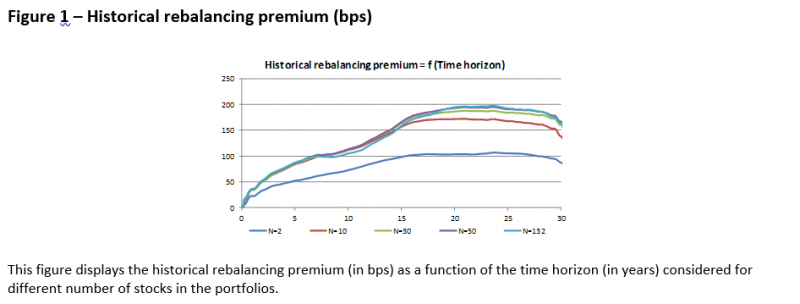
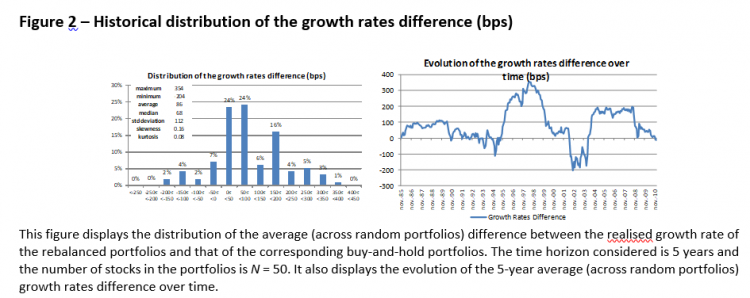
Figure 2 shows the distribution of the difference in growth rates for a 5-year time horizon and also displays the evolution of that difference over time on the period November 1985-December 2010. Each date on this chart corresponds to a 5-year period starting date. The analysis of the 5-year realized growth rates difference allows us to have a more precise view on all the 5-year historical scenarios and not only their average. The average growth rates difference, i.e., the historical 5-year rebalancing premium, is 86 bps. The growth rates difference achieves the highest value (higher than 100 bps) for the starting dates in the period January 1996-January 2000 and August 2004-October 2008, and the lowest value (lower than -50 bps) for the starting dates in the period July 2002-March 2004. We note that among the 302 historical 5-year scenarios, 36% of them display a growth rates difference higher than 100 bps, 61% display a growth rates difference higher than 50 bps and 16% display a negative growth rates difference. Overall, these results suggest that the rebalancing premium can be substantial in equity markets.
Rebalancing Premium and Stocks' Characteristics
The objective of this section is to determine whether the rebalancing premium differs for various groups of stocks. To see this, we test for the empirical relationship between the (out-of-sample) historical rebalancing premium and standard characteristics such as market capitalization, book-to- market ratio, past performance, volatility and serial correlation. We are also interested in the persistence of the criteria used in the stock selection process since it is only if the characteristic is persistent that investors could benefit from tilting their portfolio towards that particular characteristic in an attempt to increase the rebalancing premium.
We still consider the 132 stocks which were in the S&P 500 over the period November 1985- December 2015 as our base universe and take five possible time horizons: 1, 2, 3, 4 and 5 years. We do not consider longer horizons for a persistence criterion.
For a given characteristic (market capitalization for instance) we build at each initial (end-of-month) date t0 two sets (1 “high” and 1 “low”) of two portfolios (1 equally-weighted and 1 buy-and-hold):
1. The first set of portfolios (“high”) is made of the 30 best performing stocks of the base universe according to the characteristic at initial time;
2. The second set of portfolios (“low”) is made of the 30 worst performing stocks of the base universe according to the characteristic at initial time.
The investment universe for each portfolio is held constant over the corresponding time-horizon, which allows us to analyze the influence of the characteristic on the volatility pumping effect. We then compute for each characteristic and each time horizon the average rebalancing premium of the “high” and “low” sets. We compare the “high” and “low” sets to a set of portfolios built randomly with 30 stocks of the base universe. This approach allows seeing if the characteristic has an impact on the rebalancing premium.
We assess in Figure 3 that “market capitalization”, “book-to-market ratio”, “past performance” and “volatility” are sorting characteristics that have a significant impact on the rebalancing premium. Small cap, growth, past loser and high volatility portfolios display respective out-of-sample 5-year rebalancing premium of 138, 107, 131 and 125 bps when random portfolios (N=30) display in average a 5-year rebalancing premium of 85 bps. The 5-year rebalancing premium can be enhanced by more than 40 bps if stocks are selected according to a characteristic such as market capitalization rather than randomly. On the other hand “serial correlation” as a sorting characteristic does not lead to a substantially higher rebalancing premium for time horizons higher than 1 year: for instance the 5-year rebalancing premium for portfolios of stocks with negative serial correlation is 67 bps. This result suggests the presence of a relative lack of persistence of serial correlations at the individual stock level.
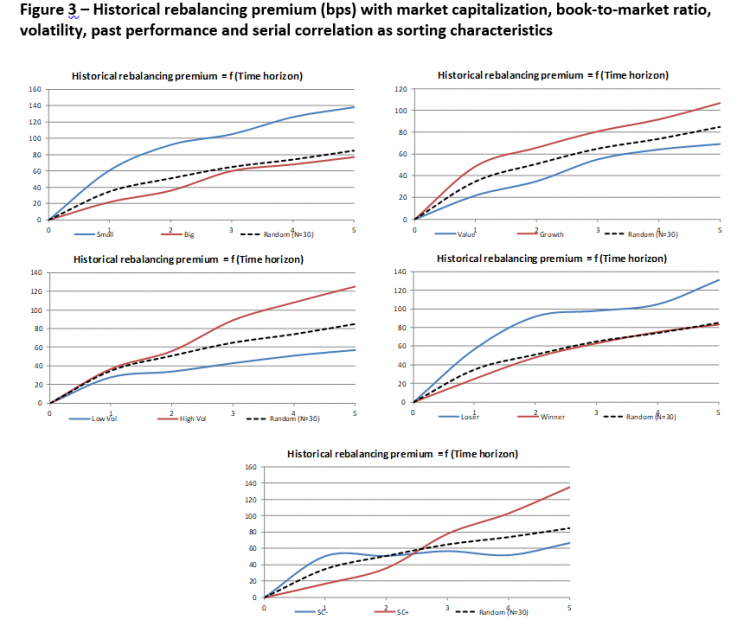
This figure displays, for different characteristics, the historical rebalancing premium (in bps) as a function of the time horizon (in years) when portfolios are sorted
by corresponding characteristic of the stocks (blue lines and red lines). The characteristics tested are market capitalization, book-to-market ratio, volatility,
past performance and serial correlation. We also display the rebalancing premium (black dashed lines) when the N = 30 stocks are randomly selected from
the base S&P 500 universe. The time horizons considered are 1, 2, 3, 4 and 5 years.
Conclusion
Using a selection of stocks from the S&P 500 universe we find an average historical rebalancing premium of almost 90 bps (in the absence of transaction costs) for a 5-year time horizon. Our analysis on individual stocks’ characteristics highlights that size, value, momentum and volatility are sorting characteristics which have a significant out-of-sample impact on the rebalancing premium. In particular, the selection of small cap, low book-to-market, past loser and high volatility stocks generates a higher out-of-sample rebalancing premium compared to random portfolios for time horizons from 1 year to 5 years. Taken together, these results suggest that a substantial rebalancing premium can be harvested in equity markets over reasonably long horizons for suitably selected types of stocks.
While our analysis has focused on an individual stock universe, it could be usefully applied to various equity benchmark portfolios such as style, sector, factor or country indices. The analysis of the volatility pumping effect may also be transported beyond the equity universe, either in a bond portfolio context or in a multi-asset context. Once a deep understanding of how to most efficiently harvest the rebalancing premium has been obtained, we could also focus on how to transport these benefits in a portfolio context. In particular, one would like to analyze the conditional performance of the rebalancing premium harvested within and across asset classes so as to better assess its diversification benefits.
This research has been supported by BdF Gestion in the context of the “Maximizing Volatility Pumping Benefits in Equity Markets” Research Chair at EDHEC-Risk Institute
About EDHEC
Operating from campuses in Lille, Nice, Paris, London and Singapore, EDHEC is one of the world’s top 15 business schools. Fully international and directly connected to the business world, EDHEC commands a strong reputation for research excellence and the ability to train entrepreneurs and managers capable of breaking new ground. EDHEC functions as a genuine laboratory of ideas and produces innovative solutions valued by businesses. The School’s teaching is inspired by its research work and a focus on “learning by doing”, all with the aim of equipping people with the skills to succeed in business.
