
Peak Smart Beta
Industry Analysis
Peak Smart Beta
David Stevenson, Research Associate, EDHEC-Risk, Chairman, ETF Stream and Columnist for the Financial Times (the Adventurous Investor), Investment Week and Money Week
If we are to believe the ETF issuers, the enthusiasm for smart beta and factor-based index trackers shows no signs of abating. Two recent sets of market data points to increased adoption. First Morningstar’s latest global survey on strategy-based ETFs shows that organic growth in the space in Europe measured nearly 11% in 2018, as these products amassed $87 billion in assets. ETFGI, a research and consulting firm has also released numbers for the first month of 2019 at the global level, suggesting that equity-based Smart Beta ETFs and ETPs listed globally gathered net inflows of $7.38 bn during January. Total assets invested in the global Smart Beta ETF and ETP industry increased 10.1%, from $618 bn at the end of December, to $680 bn. According to ETFGI, at the end of January 2019, there were 1,322 Smart Beta classified ETFs/ETPs globally, with 2,404 listings, and assets of $680 Bn, from 164 providers listed on 40 exchanges in 32 countries.
It is easy to see why many advisers and institutions are warming to the idea of strategy-based ETFs (as Morningstar prefers to label the broad category). We are told that they offer a cost-effective middle ground between ‘plain vanilla’ passive products and traditional actively managed funds, helmed by a stock-picking fund manager; or at least that is the received wisdom.
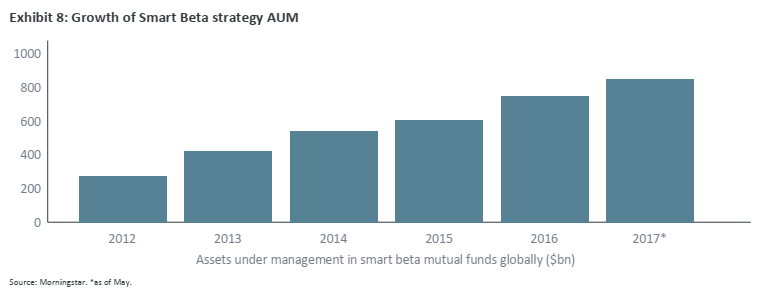
However, the global market numbers mentioned earlier also suggest that the pace of new ETF issuance is slowing. In 2018 Morningstar observed that the number of new product launches declined precipitously from the record level set in 2017. There were 132 new strategic-beta ETPs brought to market in 2018, down from 257 in 2017. According to Morningstar “the decline speaks to the fact that the menu has been saturated.”
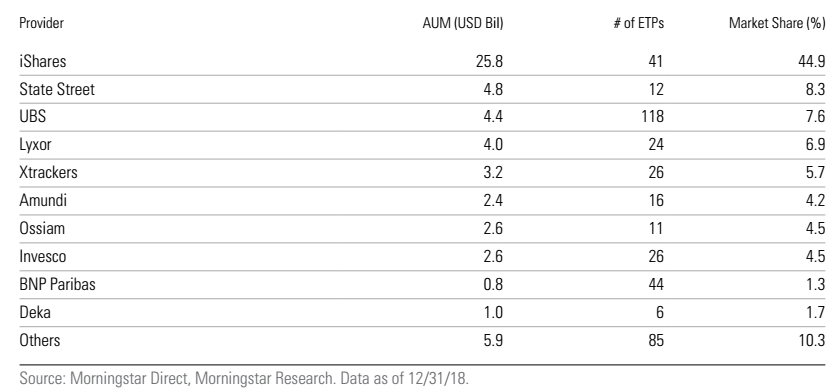
I woul highlight another interesting nugget of data from the recent Morningstar report. Despite the growing popularity of smart beta and factor ETFs, this legion of ETFs (and ETPs) still accounts for only 7.5% of total assets in Europe, a ratio that has held steady for at least the last year according to Morningstar. As an aside it is also worth noting that this market is also very much dominated by one key issuer, iShares, which currently boasts a 45% share. State Street and UBS are a distant second and third respectively, followed by a long tail of issuers. In many other markets we have also seen a dominant player emerge, but a more usual disruptive subsequent pattern is that a hegemonic player is pushed aside by either an issuer who is cheaper or producing radical, innovative products that have intensified competition. In the smart beta and factor market, this has not happened – yet.
Largest European Strategic-Beta ETP Providers in Europe
In the round, I think these numbers allow one to consider a slightly contrarian argument – that we may not be too far off “peak Smart Beta” in Europe.
Three comments from a combination of wealth advisers and fund managers nicely sums up the contrarian view. One UK fund manager says – “there are just too many ‘me too’ products out there and no one is coming up with anything that I can explain easily to my clients”. A London-based ETF strategist and fund manager states – “we sort of know all the main factors and now we’ve reached the point where we’re just filling in the blank spaces”. And crucially one last adviser, this time from Switzerland, adds – “I have a real problem with the multiplying number of ETFs and factors. It’s just too much and it forces me to take a risk by betting on wildly varying factor exposures”. This last comment is the kernel, for me, of what I think is the real challenge. Smart beta involves investors taking too many active decisions about risk and return. To understand the context behind this, let’s explore the spectrum of factor offerings and how the sheer variety sets many investors on edge.
The Smart Beta Spectrum
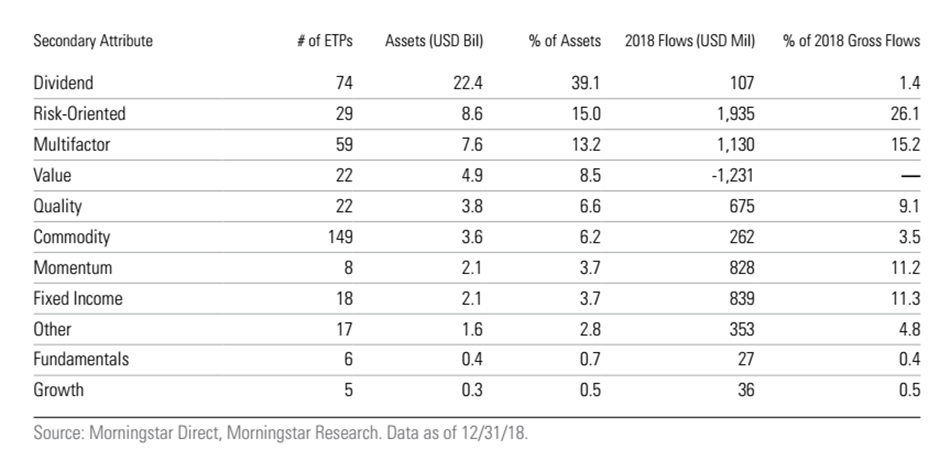
Perhaps the best place to start is to look at fund flows in recent months into the smart beta space in Europe over the last few months. The smart beta space contains within it a very broad spectrum of varying strategies or factors, many of which are proving more popular than others. ETFGI for instance reckons that multi-factor ETFs and ETPs have recently been capturing the lion’s share of monthly net inflows, at $2.36bn in January. Dividend-Factor ETFs and ETPs by contrast, saw the greatest outflows during the month, amounting to $657m. That said, looking back at numbers for the full year of 2018, Morningstar reckons that dividend-based ETFs still represent the biggest pool of assets in smart beta for Europe followed by risk oriented (which includes low vol strategies) ETFs.
Ranking of European Strategic-Beta ETPs by Strategic-Beta Group
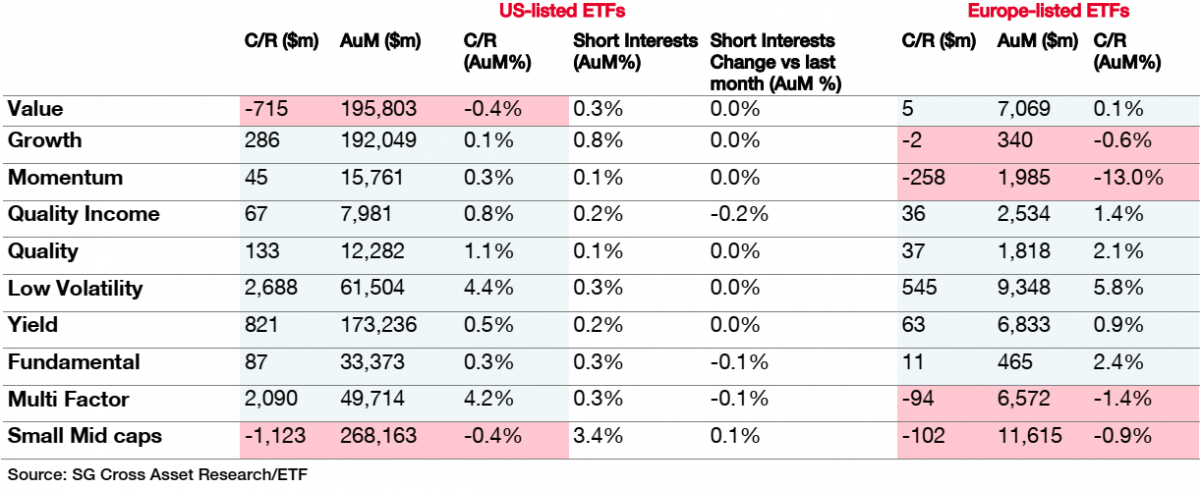
ETF analysts at French bank SocGen reported similar trends within Europe in February, with the graphic below suggesting that low volatility ETFs have proved especially popular in Europe, followed by multi factor funds. Dividend-based funds seem to be proving more popular with European investors, whereas investors on the continent appeared to moving aggressively out of small cap and value strategy ETFs in February.
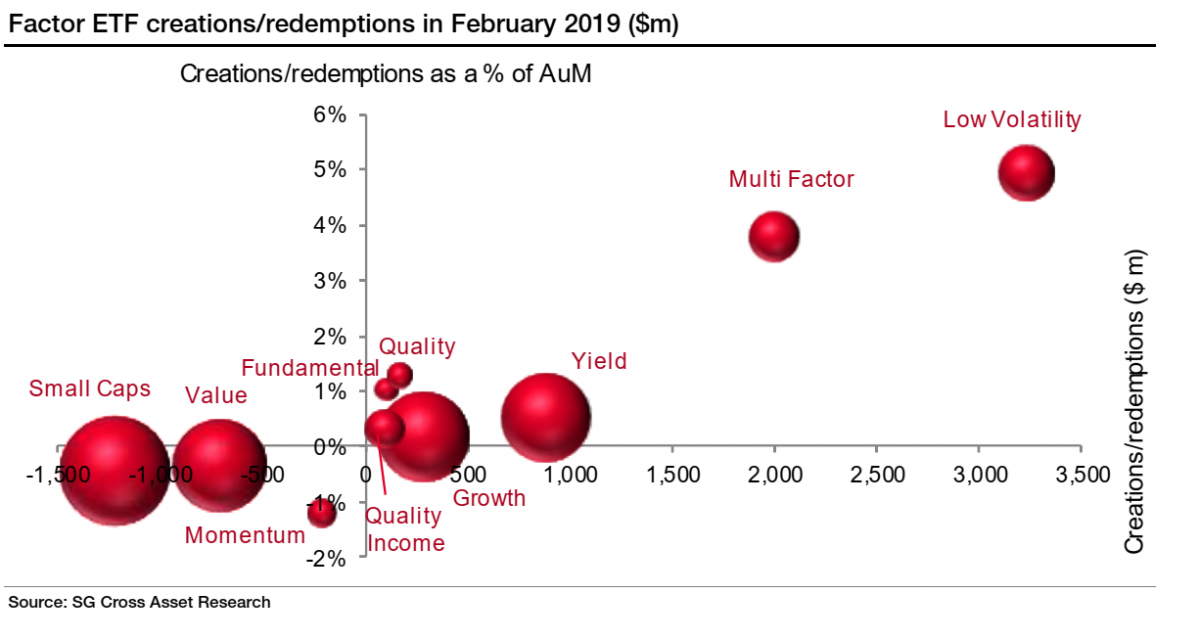
Creations & redemptions by main ETF factor strategies (February 2019)
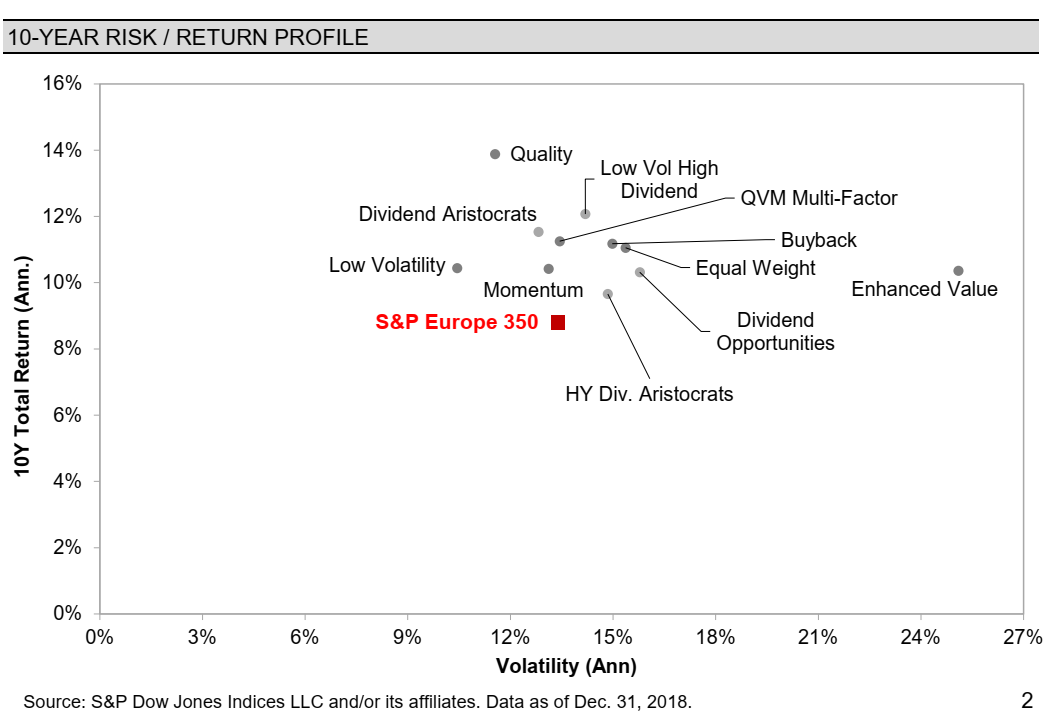
And what about returns? The numbers on different factors vary wildly on a quarter-by-quarter basis but one simple but effective way of capturing a snapshot of returns is to look at numbers for the last ten years. The chart below is from index firm S&P Dow Jones and shows the dispersion of returns and volatility for a range of their factor sub-indices. According to S&P Dow Jones, quality and low vol strategy indices perform much better than their peers, giving investors better than benchmark returns with lower risk levels (as measured by annualised volatility). Value (enhanced) by contrast emerges as a much more volatile strategy, not helped by lower returns. Intriguingly, at this ten-year level in Europe most of the popular factors perform much better than the plain vanilla benchmark. Of the 11 factor families identified, all have produced higher returns with five of the 11 boasting lower levels of volatility.
The Caveat
On paper the consistent outperformance of these various strategies sounds hugely appealing, especially if they deliver higher returns, lower volatility and cheaper than active fee structures. But there is no getting away from what I think is an essential truth – smart beta is active fund management in all but name. As Steven Goldin at asset allocation research firm Parala (and a former head of strategy indices at S&P) observes, “many smart beta strategies, if not most, are active management strategies disguised as being semi-passive. Many of these strategies have risk factor exposures, sometimes unintended, that can shift dramatically over time. In the absence of a sophisticated risk management framework, investors would be hard-pressed to be fully aware of the impact of these shifts on their aggregate portfolios…It is paramount to consider smart beta strategies as being active strategies and to apply at least the same rigour in selection as that applied to the selection of traditional active managers and strategies”.
In essence, smart beta provides active returns, but the source of active management is transferred from manager to asset owner. The chart from S&P Dow Jones above also reminds that investing in smart beta and factors does not represent a “free lunch” as these strategies can experience extended periods of underperformance when they are out of favour. Investors also need to realise that the sheer diversity of smart beta and factor-based strategies, construction methodologies and providers means that strategies have not been designed with a view to fit with each other.
One simple example – most index firms (and thus ETF issuers) have their own version of a value index but the rules governing these indices can vary enormously between index firms. Perhaps even more worryingly, individual index issuers can have different variations of the same factor within their product offerings. This all makes sense if we are chasing returns but be under no illusion about what risk the buyer is taking – active index selection risk.
Last but by no means least, many of these strategies have risk factor exposures, sometimes unintended, which can shift dramatically over time and in the absence of a sophisticated risk management framework, investors would be hard-pressed to be fully aware of the impact of these shifts on their aggregate portfolios. I think that Goldin at Parala sums it up beautifully when he says lower costs (compared to active funds) should not be the only consideration for product selection. Goldin observes that the “science of data analysis, portfolio construction and risk management is evolving rapidly. Advances in using big data and applying adaptive learning techniques to financial analysis to deal with uncertainty is gradually moving into the mainstream. If investors accept that smart beta strategies are a variation of active management, they should spend the time and effort to identify the best of breed providers that can genuinely make a difference to their long-term outcomes.”
And that brings us elegantly back to my “peak smart beta” suggestion. Smart beta ETFs are reintroducing a challenge that the disruption provided by passive funds was supposed to do away with – stop second guessing markets, don’t try and beat the markets, just invest in what Mr and Mrs Market are investing in. Chasing alpha through factor selection can be a mug’s game and forces advisers and investors to take active decisions about risk and return, decisions they are ill-suited for, especially when it comes to the increasingly arcane world of quantitative finance.
The opinions expressed in this article are those of the author. They do not purport to reflect the opinions or views of EDHEC-Risk Institute

