
Pricing Media-Derived Carbon Emission Betas
By Gideon Ozik, EDHEC Business School and Ronnie Sadka, Boston College
Abstract
ESG investing has gained significant importance in the investment community around the world. While in principle the idea of scoring firms by ESG characteristics is formidable, its implementation has proven challenging, primarily because of the difficulty in measurement. In this preliminary study we use MKT MediaStats media information reservoirs, including tens of millions of articles, to carefully measure and quantify daily a particular component of ESG, the Carbon Emission narrative. Individual-stock daily return sensitivities to changes in narrative discussion (narrative betas) are computed using historical rolling windows. A Carbon Emission factor portfolio that mimics the Carbon Emission narrative, is constructed as a long-short narrative beta return spread among S&P 500 stocks, and is shown to mimic the fluctuations in the underlying narrative (correlation of 0.43). Utilities and Real Estate sectors are negatively exposed to the narrative while the Consumer Discretionary sector exhibits a highly positive exposure. Among Financials, Banks and Asset Managers are positively exposed while Exchanges and Insurance companies are negatively exposed to the Carbon Emission narrative. Exposures seem to vary geographically in the US.
Keywords: ESG, Carbon Emission, thematic analysis.
Carbon Emissions Narrative
One of the challenges of financial professionals assessing the risk imposed by climate change is the measurement of this risk. Unlike S&P 500 return, VIX, and oil prices, there exists no single asset whose price changes largely reflect variation in measures related to climate. Not only that climate change is hard to measure, awareness of the effects and causes for climate change is varying across countries, demographics and over time. geographically and over time. As a result measuring the impact of the climate on market variables is difficult. On some days the market reacts positively and some negatively to news about climate related events, demonstrating the challenge in assessing the implications of net gainers and losers.
MKT MediaStats, a big-data information technology company specializing in financial markets, has developed a tool to quantify narratives using media coverage. MKT maintains multiple information reservoirs including bellwether reservoir (which contains all articles from the top media outlets daily), foreign exchange, country equity, corporate, interest rates, and commodities. The media information spans roughly 100,000 distinct US and international sources, amounting to about one million articles per week across these reservoirs.
The method to quantify narratives uses the articles stored in the various information reservoirs assembled by the company to measure the amount of negative sentiment coverage for a given topic each day. This results with a continuous, media-derived measure of any given narrative.
In particular, when considering Carbon Emissions narrative in Figure 1 below, we see an increase in the amount of negative news about carbon emissions since the middle of 2017 indicating higher awareness to the topics. Yet, there is significant time-series variation.
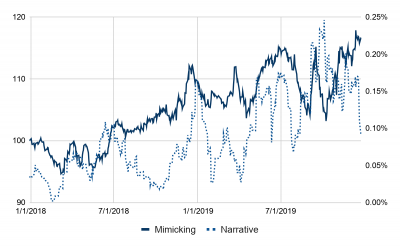
Figure 1, Carbon Emissions: Media-derived narrative and mimicking portfolio
Using the daily time series of the Carbon Emissions narrative, one can create a tradeable portfolio whose price fluctuations mimic the underlying narrative as follows. Each day, Carbon Emission betas are estimated for each stock using a multivariate regression of daily stock returns on daily stock market returns (proxied by S&P 500 index return) and the first differences in the Carbon Emission narrative (regressions use a 250-trading-day rolling window). The coefficient on the narrative, that is, Carbon Emission beta, gauges the exposure of a given stock to (unanticipated) increases in the discussion of Carbon Emissions in the media. A positive narrative beta of a given firm signifies that the equity value of the firm increases with escalation of negative Carbon Emissions narrative. A Carbon Emission mimicking portfolio is formed by going long the stocks in the top decile of Carbon Emissions beta and going short stock at the bottom decile of Carbon Emissions beta; the portfolio is rebalanced every day. The cumulative daily Carbon Emissions portfolio return since the beginning of 2016 is plotted in Figure 1. The correlation of (first differences in) the Carbon Emission narrative and quarterly returns of the Carbon Emissions portfolio is 43% since 2018. The long/short Carbon portfolio yielded roughly 16% since January 2018.
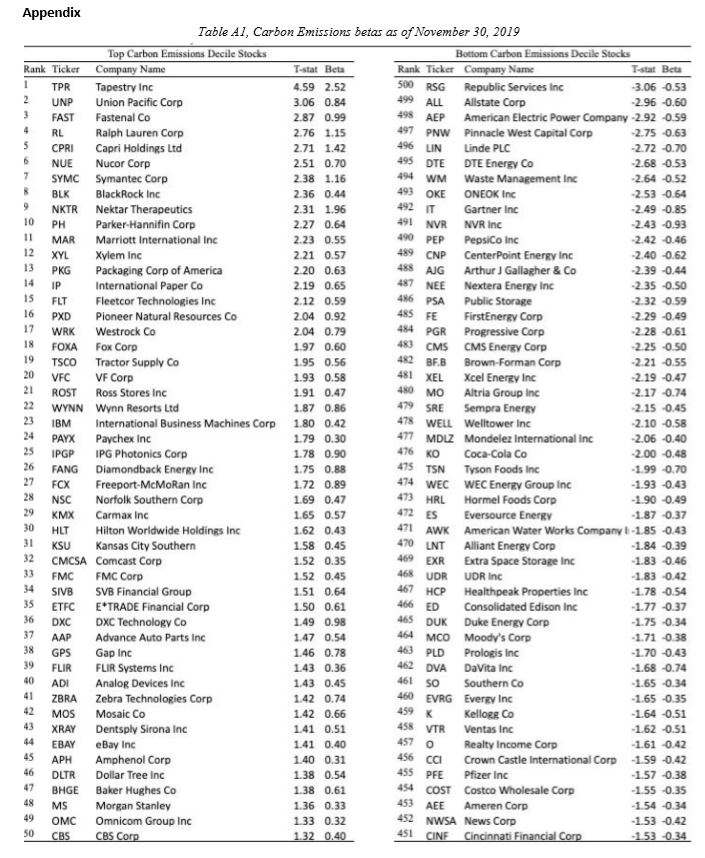
Carbon Emissions Exposure
To take a closer look at the Carbon Emission exposure, we record Carbon Emission betas as of November 31, 2019. The top 50 and bottom 50 companies in order of beta t-statistic are presented in Table A1 of the Appendix. Notably, the top of the list includes Tapestry Corp, Union Pacific Corporation, Fastenal Company, Ralph Lauren Corp and Capri Holdings Ltd, while the bottom of the list includes Republic Services, Inc., Allstate Corp, American Electric Power Company Inc, Pinnacle West Capital Corporation, Linde PLC, and DTE Energy Co.
We perform a sector attribution analysis in Figure 2, using the GICS sector classification (11 sectors). Specifically, we count the number of firms in each of the top and bottom deciles of t-statistic of narrative betas (50 firms in each decile) per sector.
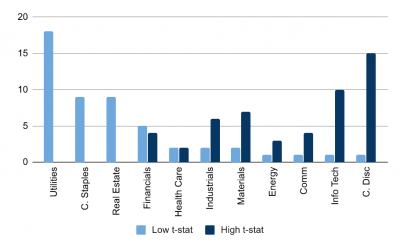
Figure 2, Carbon Emissions beta: Sector attribution
There are fifteen Consumer Discretionary firms in the top decile but only one in the bottom decile. There are also ten Information Technology firms in the top decile but only one IT company in the bottom decile. The bottom decile predominantly consists of Utilities, Consumer Staples, and Real Estate firms. The Financial sector provides a unique perspective, with five firms in the bottom decile and 4 in the top deile. This significant intra-sector variation is further studied in Figure 3.
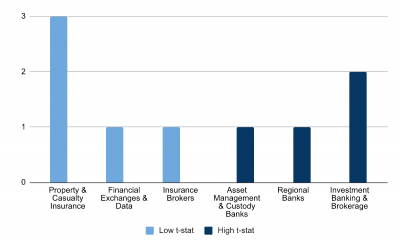
Figure 3, Carbon Emissions betas of financial firms
This figure breaks down financials to industry groups: regional banks, insurance companies, insurance brokers, asset management firms, investment banks, and exchanges and financial information firms. Two investment banks/brokerage firms, a regional bank and an asset manager are in the top decile, while three insurance companies, an insurance broker and financial exchange / data are in the bottom decile.
Next, we analyze the daily return stream of the Carbon Emissions mimicking portfolio with respect to a four factor asset pricing model (the Fama-French three-factor model plus momentum). The mimicking portfolio exhibits insignificant exposures to the Market factor (regression coefficient of -0.06 and t-stat of -0.9), SMB (-0.07 and -0.72) and HML (-005 and -1.14). The momentum factor exposure is negative with a significant regression coefficient of -0.44 and t-stat of -3.1, suggesting that Carbon Emissions mimicking portfolio is negatively exposed to momentum. The 4-factor alpha is significant at 0.03% a day (8.07% annually) and t-stat of 2.91.
Finally, a geographic presentation is exhibited in Figure 4. The average t-statistic of Carbon Emissions beta across companies headquartered in each state is calculated as of November 30, 2019. There is no clear inter-state differentiation, though a large portion of the midwest, including Oklahoma, Arkansas, Kentucky, Ohio, Michigan, Wisconsin, Illinois, and Missouri, is negatively exposed to shocks in negative news about Carbon Emission.
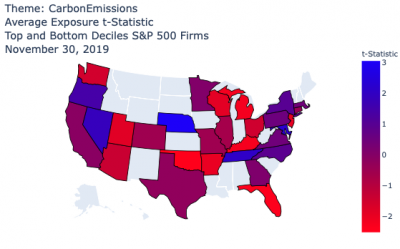
Figure 4, Carbon Emissions beta: Geographic attribution
Conclusion
This study demonstrates the method by which the market price of narratives can be assessed. Otherwise difficult-to-quantify narrative risks can be measured as beta exposures to media-derived narrative factors. A preliminary examination of Carbon Emissions risk studied here suggests this risk is priced in the cross-section of large-cap US stocks, with varying systematic exposures to certain sectors and geographical regions in the US.
Appendix
Rubrique
About EDHEC
Operating from campuses in Lille, Nice, Paris, London and Singapore, EDHEC is one of the world’s top 15 business schools. Fully international and directly connected to the business world, EDHEC commands a strong reputation for research excellence and the ability to train entrepreneurs and managers capable of breaking new ground. EDHEC functions as a genuine laboratory of ideas and produces innovative solutions valued by businesses. The School’s teaching is inspired by its research work and a focus on “learning by doing”, all with the aim of equipping people with the skills to succeed in business.
