
Replication of real estate indices: Evidence from the French property investment market
By Béatrice Guedj, Head of Research and Innovation, Swiss Life Asset Managers France; Lionel Martellini, Professor of Finance, EDHEC Business School, Director, EDHEC-Risk Institute; Shahyar Safaee, Research Director & Head of Business Development, EDHEC-Risk Institute
The shift from active to passive investing has been a broad and defining trend of the investment management industry over the last decade. According to Morningstar, assets of US passive equity funds represented more than half of the overall assets of equity funds at the end of 2020. This compares to approximately 20% at the end of 2010. Index tracking has therefore become a priority for asset managers and ultimately for investors, who expect passive strategies to replicate an index in a reliable and cost-efficient way. Index strategies are now commonly available to investors not only in the equity asset class but also in fixed income, credit and indirect real estate, via exchange-traded funds or mutual funds invested in listed (equity) real estate investment trusts (REITs).
However, the design of representative and investable direct property indices has historically raised a number of issues related to the heterogeneity and indivisibility of real estate assets, the procyclicality of transaction volumes, the relative lack of investability (the index components are generally not available for sale), the appraisal-based valuation process, as well as more subtle effects such as temporal aggregation (see for example Geltner [2015] and EDHEC [2009] for further details on all the issues mentioned). Nevertheless, investable passive strategies tracking the direct real estate market could serve two important purposes. First, they could help deliver systematic exposure to the asset class without the unwanted short-term volatility (primarily the result of a liquidity tradeoff) that typically accompanies REITs, thus providing investors with an important source of diversification and risk-adjusted performance inside their multi-asset portfolios; second, the bond-like nature of the asset class makes passive real estate strategies promising building blocks (alongside traditional fixed income) for the construction of incomegenerating investment solutions in retirement.[1]
The EDHEC IEIF Commercial Property (France) index (EDHEC IEIF index) addresses some of the issues mentioned above, in the context of the French commercial real estate market (see EDHEC [2009] for more details) by using publicly registered non-listed funds known as Société Civile de Placement Immobilier (SCPI). Put simply, the EDHEC IEIF index is a market capitalisation-weighted portfolio of commercial SCPIs that satisfy a minimum liquidity requirement. It is investable by design, which makes it an appropriate benchmark for investors seeking passive exposure to French commercial real estate, whether it is to improve the risk-adjusted return of a multi-asset portfolio or to enrich a goal-hedging (retirement) portfolio.
In practice, however, an investor willing to track the EDHEC IEIF index would likely not consider a ‘full replication’ approach (ie, at all times holding every component in the exact proportion prescribed by the index) because of the transaction costs generally associated with SCPIs and the limited liquidity of some index components. Interestingly, prior research on SCPIs (see Guedj et al [2021]) shows investors can actually construct efficient and diversified SCPI portfolios with a limited number of constituents. In this context, this article analyses the practical implementation of a passive SCPI strategy tracking the EDHEC IEIF index; our study also considers the ability of an SCPI portfolio to help replicate the underlying direct real estate investment market, namely the MSCI France Annual Property index (MSCI index). We conclude the article with an assessment of the impact of smoothing on tracking error estimations. Our analysis relies on the same 2003–19 historical dataset (including 53 commercial SCPIs) as that used by Guedj et al (2021), which was kindly provided by the Institut de l’Epargne Immobilière et Foncière (IEIF), the leading independent research organisation covering the French real estate investment market. At any point during the 2003–19 period, our dataset covers at least 80% of the total market capitalisation of the EDHEC IEIF index universe.
Index tracking when full replication is impractical
The academic literature has extensively tackled the problem of index tracking when full (ie, perfect) replication cannot be implemented (because of operational and/or transaction costs), formalising it as a complex constrained optimisation problem[2] whereby one seeks a suitable subset of the index portfolio that mimics the full index as closely as possible. Sophisticated replication methods are data-intensive and more suited to liquid asset classes like equities. Less liquid asset classes like real estate may be handled with simpler heuristics, such as a two-step approach where the selection of index components and the portfolio allocation (weighting) across the selected components are handled separately.
Our approach involves designing selection and allocation processes that account for the specific features and constraints of the index replication problem at hand, and then testing alternative approaches to assess the robustness of our results. We consider four specific features and/or constraints. First, the relative scarcity of data (longdated individual SCPI performance available on a semi-annual basis only) leads us to favour heuristic methods over optimisation-based methods, although the latter are considered in robustness checks. Second, given the low liquidity of SCPIs, we aim for a limited number of constituents in the portfolio and seek to avoid holding positions in the smallest SCPIs since these usually have the lowest liquidity. Third, the significant transaction costs incurred by SCPI investors make dynamic rebalancing impractical, so we favour a buy-and-hold approach when designing the replicating portfolio; the portfolio is therefore constructed on day one and held static for the entire investment period. Finally, both the EDHEC IEIF index and the MSCI index follow a cap-weighted portfolio allocation, which precisely requires a buy-and-hold approach (since, in the absence of corporate actions, price fluctuations fully explain market cap fluctuations); this is therefore another reason to favour a buy-and-hold portfolio construction.
Based on the considerations mentioned above, we propose to test the following replication methodology on our historical SCPI dataset:
- Two-step approach: we first select a set of SCPIs and then determine the portfolio allocation
- Portfolio size: we set a fixed number (N) of SCPIs, eg, N = 10.
- Selection process: we retain the N largest SCPIs (ranked by market capitalisation), subject to the same liquidity filter as that used in the EDHEC IEIF index (see EDHEC [2009]).
- Allocation process: we set the weights to be proportional to market capitalisation (ie, a ‘cap-weighted’ allocation).
- Rebalancing: we opt for a buy-and-hold approach, so there is no rebalancing once the initial portfolio has been established.
Our results cover 10 overlapping historical backtesting periods (December 2003–December 2019, December 2004– December 2019, .…, December 2012– December 2019) and five different portfolio sizes (N = 5, 10, 15, 20, 25). All our results are based on gross total returns, both for the indices and the SCPI portfolios.[3] For each backtest, we compute two indicators to assess the quality of the replication, the annualised mean excess return (MER) and the annualised tracking error (TE), which we define as follows:
where  and
and  are respectively the replicating portfolio return and the index return at period t, and M is the number of periods in a year.
We use semi-annual returns (M = 2) when attempting to replicate the EDHEC IEIF index, and annual returns (M = 1) when attempting to replicate the MSCI index.
Our robustness tests aim to assess the sensitivity of our results with respect to a change in the methodology, and we therefore consider alternative selection methods (eg, segmentation) and/or allocation methods (eg, equal weights, TE-minimising weights).
Replication of the EDHEC IEIF index
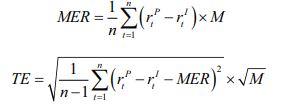
Our proposed methodology naturally leads to potential replication error, due to two primary causes. First, our selection of SCPIs (at the time of investment) only represents a subset of the full EDHEC IEIF index universe. Second, our buyand-hold portfolio does not keep track of changes in the index universe, ie, the portfolio does not change when SCPIs get added to or removed from the index. Our replicating portfolio therefore differs from the index on day one, and potentially diverges away from the index over time. Figure 1 reports the replication results (MER and TE) for the EDHEC IEIF index. We see that the quality of replication improves as we increase the number of SCPIs in the replicating portfolio: we observe a MER closer to zero (on average) and a lower TE for a portfolio of 25 SCPIs than for a portfolio of five SCPIs. This is in line with expectations since increasing the number of SCPIs mechanically mitigates the first cause of replication error mentioned previously. Additionally, we note that the empirical MER monotonically increases as we add SCPIs to the portfolio, indicating that smaller SCPIs may be a source of outperformance. This is consistent with the findings of Guedj et al (2021) related to the ‘fund size’ attribute, namely that small SCPIs have outperformed their larger counterparts by a statistically significant amount (approximately 2% per annum) over the 2003–19 period. The monotonic relationship between MER and number of SCPIs in the portfolio may also be linked to the performance difference empirically observed by Guedj et al (2021) between surviving and non-surviving SCPIs (since non-survivors historically fall inside the lower size quartiles of the population) although this difference is not statistically significant.
Figure 1 – Mean Excess Return and Tracking Error (EDHEC IEIF Index)
From a quantitative standpoint, the low level of TE (between 0.4% and 1.3%) displayed in figure 1 is comparable to levels previously reported by the literature related to investable passive index-tracking strategies. For example, Lee (2014) analyses the performance and tracking error of UK real estate funds and identifies a group of ‘pure index’ funds whose TE is between 2% and 4% depending on the property fund benchmark selected. Additionally, publications related to other asset classes report that ‘passive’ equity funds are those with a TE of 1% or less[4], and that it is possible to use a samplingbased approach to replicate one investment grade index and one high-yield corporate bond index with TE levels of 0.9% and 2.6% respectively.[5] Note that the comparison with other asset classes should be interpreted with caution since SCPI data, unlike equity or bond data, is often subject to significant smoothing (see the last section of the article for an assessment of smoothing effects on TE).
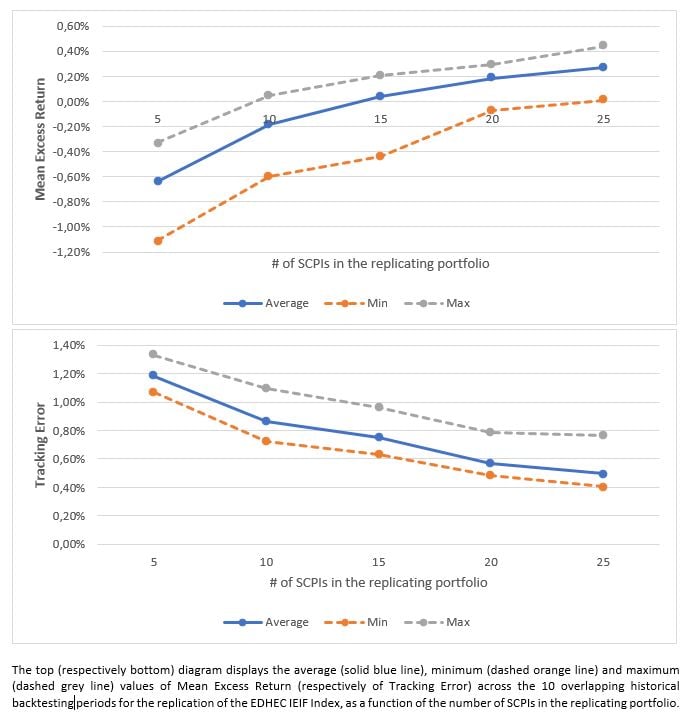
We conclude this section with a review of the robustness tests presented in figure 2. Because the SCPI universe comprises both open-end and closed-end vehicles, we enrich the selection method with a common form of segmentation (stratified sampling) based on the capital type of SCPIs, ensuring that the replicating portfolio is consistent, at the time of its construction, with the overall mix (% of open-end versus % of closed-end) of the EDHEC IEIF index. Our tests also include an alternative allocation method based on equal weights at the time of investment without any rebalancing (ie, still a buy-and-hold approach). We find in figure 2 that the qualitative features detailed above remain unchanged: average MER increases and average TE decreases with the number of SCPIs in the portfolio. We note that segmentation has very little impact on results and that an equalweighted allocation unsurprisingly magnifies the positive impact of small SCPIs on performance (resulting in higher MER levels overall) and reduces the benefit of adding new SCPIs in a portfolio attempting to replicate a cap-weighted index (resulting in higher TE levels overall).
Figure 2 – Robustness Tests: Mean Excess Return and Tracking Error (EDHEC IEIF Index)
Replication of the MSCI index
Unlike the EDHEC IEIF index, the MSCI index is not designed to be investable for it measures the unlevered performance of directly held property investments from one appraised valuation to the next. Indeed, the real estate assets included in the index universe are generally not available for sale, they are not carved up into small identical and tradeable pieces of equity ownership, and their actual selling price is not necessarily equal to their appraised value, making the MSCI index difficult to replicate in practice.
We nevertheless have at our disposal two classes of French real estate investments that allow investors to indirectly purchase (at least partially) the assets making up the MSCI index: non-listed real estate funds (SCPIs) and the French equivalent of listed REITs, Sociétés d’Investissement Immobilier Cotées (SIICs). A representative and investable index for SIICs is the Euronext IEIF SIIC France index. Schoeffler (2012) indicates that the EDHEC IEIF index is a better proxy than the Euronext IEIF SIIC index for the underlying direct real estate market, while Delfim and Hoesli (2019) report, in a US context, that non-listed funds are a better substitute for direct investments than REITs. We therefore view SCPI portfolios as natural candidates for the replication of the MSCI index, and we take further comfort from the fact that the SCPI universe and MSCI index have similarly broad exposure (respectively 60% and 62% as of the end of 2019) to the office sector, which contrasts with the traditionally large retail bias in the SIIC universe.
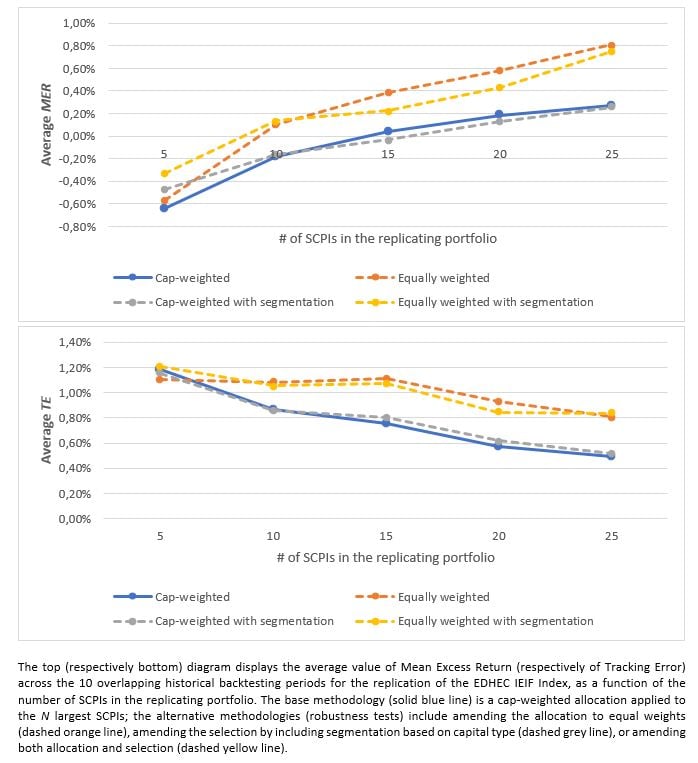
However, one may be tempted to try and include some SIIC exposure in a portfolio seeking to replicate the MSCI index because the latter represents a pool of assets that is approximately three times larger than the SCPI market capitalisation, and because recent research covering several countries including France (see Hoesli and Oikarinen [2021]) has provided evidence that REITs do behave like direct real estate over mid to long-term periods once leverage is adjusted for. Figure 3 visually confirms our intuitions: the EDHEC IEIF index closely tracks the MSCI index once we adjust for fees, and the unlevered Euronext IEIF SIIC index seems to help explain some of the volatility specifically observed in the MSCI index; we also note that the overall performance in 2003–19 is very similar for all three indices, respectively 7.9%, 7.6% and 7.8% compound annual growth rates over the period.
Figure 3 – Total Return Performance of MSCI Index minus fees, EDHEC IEIF Index and Euronext IEIF SIIC Index unlevered (2003–2019)
We attempt to quantitatively confirm our expectations with a linear regression (without any adjustment) of the total returns of the MSCI index against those of the two other indices. We obtain a relatively low adjusted R² of 35% and note that only the EDHEC IEIF index has explanatory power (p-values of 1.4% and 52% respectively for EDHEC IEIF index and Euronext IEIF SIIC index). However, when replacing the listed real estate index with its ‘one-year lagged’ version, we see the adjusted R² increase to 70% and find evidence of explanatory power for the lagged Euronext IEIF SIIC index variable (p-values now respectively 1.5% and 0.2%). We observe a similar pattern when attempting to replicate the MSCI index with a portfolio combining the two other indices, as shown in figure 4. We find that adding 10% of SIICs to the portfolio increases the TE for every investment horizon, while adding 10% of ‘lagged SIICs’ decreases the TE for longer investment horizons as well as on average across all horizons. This behaviour is consistent with the smoothing effect generally observed in appraisal-based indices and the resulting time lag against market-based (listed) counterparts (see Geltner [1993] for an introduction to the issue of lagged/smoothed data in the context of real estate investments). Implementing lagged exposure in a replicating portfolio is not straightforward and we therefore limit ourselves to SCPI portfolios going forward and follow the same replication methodology as that used for the EDHEC IEIF index.
Figure 4 – Impact of SIICs on Tracking Error (MSCI Index)
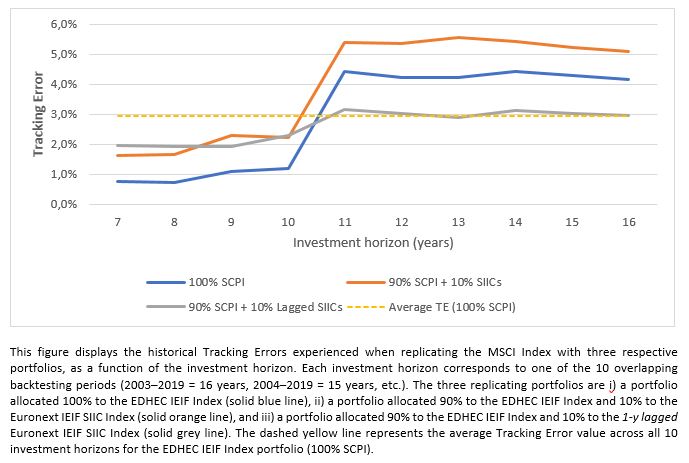
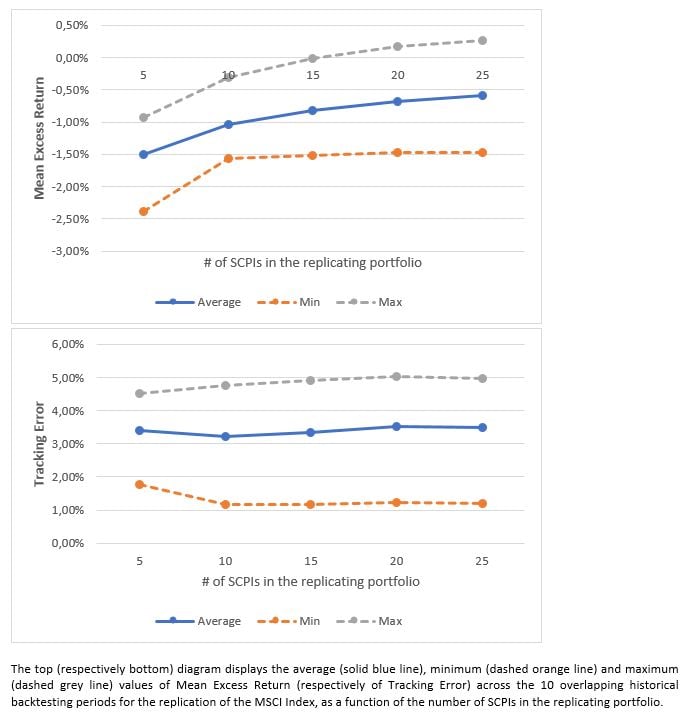
The replication results presented in figure 5 are consistent with expectations. While we continue to see the positive impact of smaller SCPIs on performance (with negative average MER levels in line with the typical management fees applied by SCPIs), the MSCI index property universe is too large (compared to the assets held by SCPIs) for us to observe a decline in TE as we increase the number of SCPIs in the portfolio. The TE levels achieved (between 3% and 4% on average, and no greater than 5% overall) are consistent with past results reported by the industry over a comparable period[6] (5–6% TE when attempting to replicate a pan-European version of the MSCI index with 10 to 20 non-listed real estate funds).
Figure 5 – Mean Excess Return and Tracking Error (MSCI Index)
The robustness tests presented in figure 6 include the usual equal-weighted allocation method as well as the insample allocation that minimises TE (Min TE allocation) over each historical backtesting period. Unlike for the EDHEC IEIF index replication, the equal-weighted allocation does not lead to worse average TE levels compared to the cap-weighted allocation, despite the cap-weighted nature of the MSCI index. This is most likely again because of the much larger size of the MSCI index property universe: when the selection process is largely imperfect because only a small subset of the index components is captured in the portfolio, the allocation process becomes less relevant and the allegedly ‘aligned’ weighting scheme no longer dominates the other schemes. In the context of an SCPI-based replication of the MSCI index it therefore seems preferable, subject to liquidity considerations, to opt for an equal-weighted allocation and save 30–40bps of annual underperformance while keeping a similar level of TE.
Figure 6 – Robustness Tests: Mean Excess Return and Tracking Error (MSCI Index)
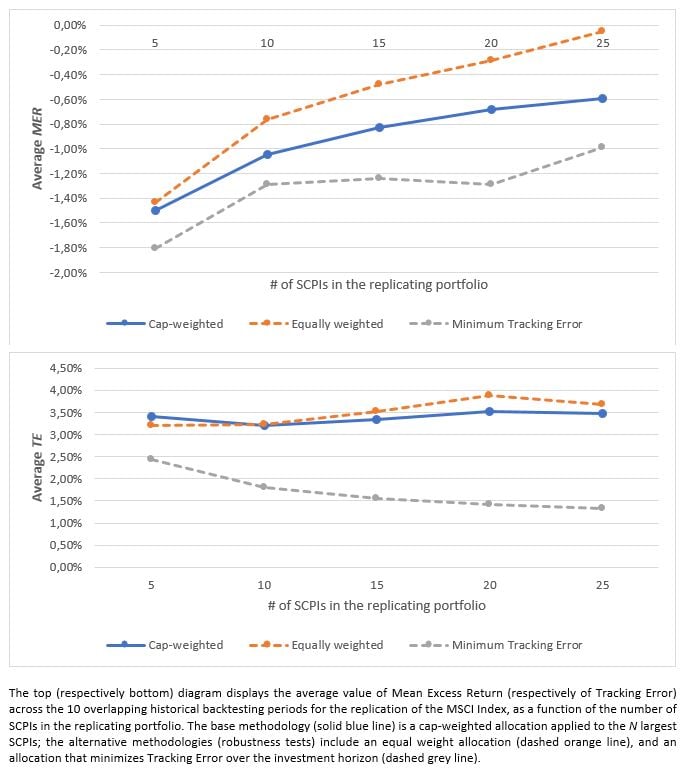
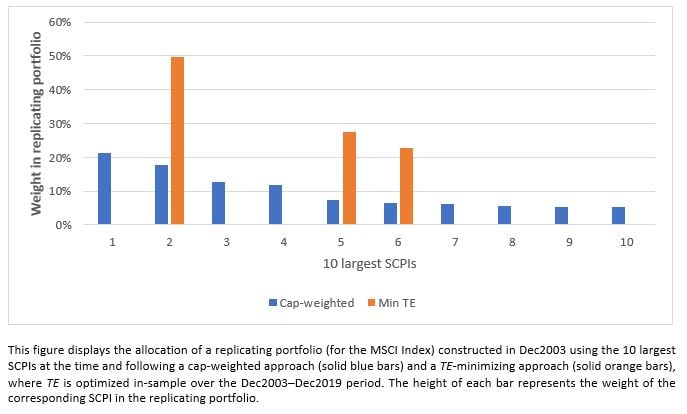
We conclude this section with a review of the results of the Min TE allocation (see figure 6) that effectively provides a theoretical, in-sample, lower bound in terms of TE. Of course, such an allocation cannot be implemented since it requires an in-sample minimisation, but it is nevertheless informative. Indeed, we note that a full look-ahead bias would allow us to approximately halve the TE (down to about 1.5% on average) but at the expense of MER, with an underperformance ‘cost’ of 50–100bps per annum compared to the equal-weighted allocation. This trade-off seems even less compelling when looking at figure 7, which shows one example of a Min TE allocation with 10 SCPIs in the portfolio. The high concentration in the optimal portfolio (only invested in assets 2, 5 and 6) is indeed an indication of data overfitting and likely out-of-sample sub-optimality and instability. We would therefore recommend avoiding such an optimised allocation, especially in the presence of material transaction costs.
Figure 7 – Robustness Tests: “Cap-weighted” vs “Min TE” allocation with 10 SCPIs (MSCI Index)
Accounting for smoothing in the tracking error estimation
Given the presence of smoothing effects in our data, the goal of this final section is to examine the potential impact of smoothing on our TE results. More specifically, we wish to know whether our TE estimates could be severely underestimated due to smoothing, the same way estimates of non-listed or direct real estate volatility can sometimes be materially underestimated. As a reference, Guedj et al (2021) report that the volatility of open-end SCPIs doubles on average after correcting for smoothing effects.
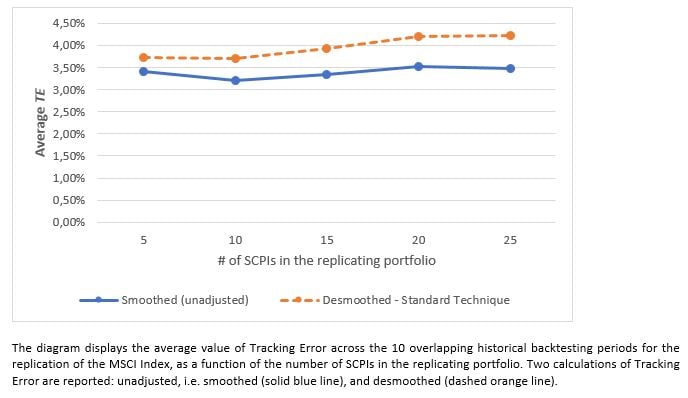
We apply the standard desmoothing technique (see Geltner [1993] for a general description, and Guedj et al [2021] for a direct application to SCPIs) to the excess returns of the replicating portfolio with respect to its target index. This leads us to a desmoothed estimate of the standard deviation of excess returns, ie, a desmoothed estimate of TE. Figure 8 presents some results for the EDHEC IEIF index replication. The average desmoothed TE is only moderately higher (between 1.09x and 1.26x) than the average smoothed (unadjusted) TE. We also report that the maximum TE observed across all portfolios and all backtesting periods is 1.8%, so it appears that smoothing only has a modest impact on the estimation of TE for the EDHEC IEIF index replication. We report results for the MSCI index replication in figure 9. The average desmoothed TE is between 1.09x and 1.21x higher than the average smoothed (unadjusted) TE, indicating again that smoothing does not materially distort TE estimates. The maximum TE observed across all portfolios and all backtesting periods is 6.4% (compared to 5.0% before correcting for smoothing), which seems modest considering the annualised volatility estimate of the MSCI index increases by 1.7x (from 5.4% to 9.4%) when corrected for smoothing.
Figure 8 – Desmoothing of Tracking Error (EDHEC IEIF Index)
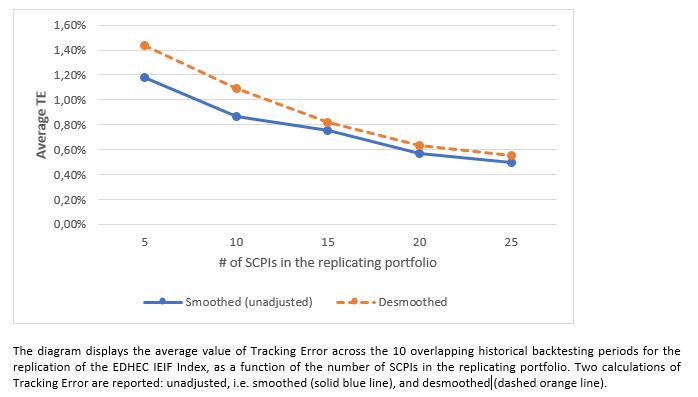
Figure 9 – Desmoothing of Tracking Error (MSCI Index)
Conclusions
We find that it is possible to track the EDHEC IEIF Commercial Property (France) index with a satisfactory degree of accuracy (based on mean excess return and tracking error) over long-term horizons by constructing a buy-and-hold and cap-weighted portfolio of 10 to 15 SCPIs, thereby mitigating the liquidity constraints of the French non-listed real estate fund market. Our proposed replication method does not require any modelling or any data-intensive calculation and is therefore expected to be robust.
Additionally, our analysis shows that a buy-and-hold and equal-weighted portfolio of 10 to 15 SCPIs can be seen as a reasonable proxy of the MSCI France Annual Property index. We also confirm that French listed real estate companies (SIICs) have the potential to complement SCPIs to further improve the replication of the MSCI France Annual Property index, although the exact portfolio implementation will likely require a model for the smoothing effect embedded in appraised valuations.
Our work could naturally be extended by including more specific liquidity constraints and criteria in either the selection or the allocation process. In conclusion, it appears that investors looking for passive exposure to the French commercial real estate asset class, either to enhance the risk-adjusted return of their multi-asset portfolios or to construct a multi-asset retirement goal-hedging portfolio, can potentially gain access to a simple and investable solution.
The research from which this article was drawn was produced as part of the Swiss Life Asset Managers France Real Estate in Modern Investment Solutions research chair at EDHEC-Risk Institute.
Footnotes
[1] For more details on goal-based retirement investing, see L. Martellini and V. Milhau (2021). Advances in Retirement Investing. Cambridge University Press.
[2] See K. Benidis, Y. Feng and D. P. Palomar (2018). Optimization Methods for Financial Index Tracking: From Theory to Practice. Foundations and Trends in Optimization 3(3): 171–279.
[3] We follow Guedj et al (2021): gross total return for an SCPI does not include subscription fees and is defined as where St and Dt,t+1 are respectively the reported subscription price at time t and the gross dividend amount paid between ]t,t+1].
[4] A. Alford, R. C. Jones and K. D. Winkelmann (2003). A Spectrum Approach to Active Risk Budgeting. Journal of Portfolio Management 30(1): 49–60.
[5] L. Gouzilh, M. de Jong, T. Lebaupain and H. Wu (2014). The Art of Tracking Corporate Bond Indices. Amundi Working Paper.
[6] INREV (2014). The Investment Case for Core NonListed Real Estate Funds. Working paper, INREV Research and Market Information.
References
Delfim, J.C., and M. Hoesli (2019). Real Estate in MixedAsset Portfolios for Various Investment Horizons. Journal of Portfolio Management 45(7): 141–158.
EDHEC (2009). Real Estate Indexing and the EDHEC IEIFCommercial Property (France) Index. EDHEC-Risk Institute Publication.
Geltner, D. (1993). Estimating Market Values from Appraised Values without Assuming an Efficient Market. Journal of Real Estate Research 8(3): 325–345.
Geltner, D. (2015). Real Estate Price Indices and Price Dynamics: An Overview from an Investments Perspective. Annual Review of Financial Economics 7(1): 615–633.
Guedj, B., L. Martellini and S. Safaee (2021). Benefits of Open Architecture and Multi-Management in Real Estate Markets – Evidence from French Nonlisted Investment Trusts. Journal of Portfolio Management 47(7): 112–130.
Hoesli, M., and E. Oikarinen (2021). Does Listed Real Estate Behave Like Direct Real Estate? Updated and broader evidence. Applied Economics 53(3): 1–20.
Lee, S. (2014). No.17 Tracking Error and Real Estate Fund Performance. Working paper, Cass Business School, City University London.
Pope, P. F., and P. K. Yadav (1994). Discovering Errors in Tracking Error. Journal of Portfolio Management 20(2): 27–32.
Ruud, A. (1980). Optimal Selection of Passive Portfolios. Financial Management 9(1): 57–66.
Schoeffler, P. (2012). Les estimateurs de marché optimaux de la performance de l’immobilier de bureaux en France. EDHEC-Risk Institute Publication.
About EDHEC
Operating from campuses in Lille, Nice, Paris, London and Singapore, EDHEC is one of the world’s top 15 business schools. Fully international and directly connected to the business world, EDHEC commands a strong reputation for research excellence and the ability to train entrepreneurs and managers capable of breaking new ground. EDHEC functions as a genuine laboratory of ideas and produces innovative solutions valued by businesses. The School’s teaching is inspired by its research work and a focus on “learning by doing”, all with the aim of equipping people with the skills to succeed in business.
