What impact should we expect from socially responsible investing?
By Jonathan Harris, Director, Total Portfolio Project and EDHEC-Risk Associate Researcher
I apply the general equilibrium framework of EDHEC’s Prof. Laurent Calvet to the case of socially responsible investing. I show that it need not be the case that investors must sacrifice returns to invest responsibly. I also show that responsible investors do best, and have the most impact, when they fully integrate their sustainability beliefs into their investment processes.
Socially responsible investing continues to be one of the fastest growing topics in finance. With the ongoing implementation of the EU’s sustainable finance plan, significant developments are set to continue and we are likely to see increasing standardization over the coming decade. Hence, it seems valuable to take a moment to reflect on what the impacts of sustainable investing are likely to be and how they can be made as positive as possible. Not least because EDHEC's motto is 'make an impact'.
A rigorous understanding of the potential impact of sustainable investing is important as we continue together as an industry on this journey. As written in the recent Investor’s Guide to Impact from Zurich’s Center for Sustainable Finance and Private Wealth: "Investors can play a crucial role in helping to solve the global challenges we are facing. However, to unlock this potential we need to be clear about how investors can drive real change".
Analyzing impact in a theoretically rigorous way requires, at least, a general equilibrium model that allows for investor’s financial decisions to impact the real economy. Most standard models in financial economics, like the CAPM, are partial equilibrium models where investors' choices don’t change the size and performance of the underlying stocks.
In a seminal paper in this regard, Heinkel, Kraus and Zechner (2001) developed a model which showed that with enough green investors in the market, a portion of polluting firms could be induced to clean up. However, their model was binary and didn’t allow for firms to make small improvements. Fast forwarding to recent times, Pastor, Stambaugh and Taylor (2020) find more general results by soldering on a general equilibrium to their partial equilibrium model. They produce many interesting results, but ultimately miss the demand (firm) side effects that I explain in this article.
Recently, EDHEC’s own Laurent Calvet and his coauthors have developed a general equilibrium model that by default links investor and firm decisions. In the rest of this article I use an extension of their model to examine the (potential) impacts of different high-level options in the sustainable investors toolbox.
Supply and demand considerations
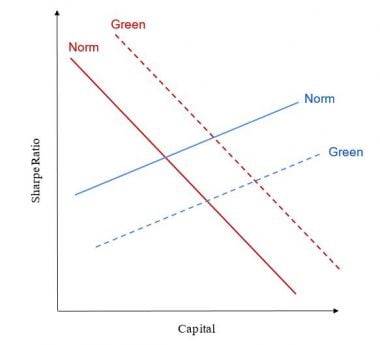
The key insight of the Prof. Calvet’s model is that one must consider the effect of asset pricing both on the supply of capital (what portion of their portfolios investors are willing to allocate) and the demand for capital (how much capital each firm seeks to raise). This is illustrated for a single firm in Figure 1 which shows the supply and demand curves for capital. The lower a firm’s Sharpe ratio, the cheaper is its cost of capital, and so the more capital it seeks to raise. On the supply side, the higher the Sharpe ratio of a firm's equity the more investors will wish to allocate to it. Equilibrium occurs where the two curves meet

Figure 1: The capital supply (blue) and demand (red) curves for a single firm,
with (‘Green’) and without (‘Normal’) the firm having positive sustainability characteristics.
The CAPM, and other partial equilibrium models, would have a flat demand curve. Equilibrium would always occur at the firm’s fixed Sharpe ratio. Whereas with a slope in both the supply and demand curves, the Sharpe ratios and capital amounts can be non-trivial.
How does sustainability fit into this framework? It can have impacts on both the demand curve and the supply curve. On the supply side, if investors have a preference for green firms they will be willing to allocate more capital at lower Sharpe ratios. This is the dashed blue curve in Figure 1. On the demand side, if a firm (and its investors) believes it is creating value beyond its profits, it will seek to raise more capital even at higher Sharpe ratios (costs of capital). This is the dashed red curve in Figure 1.
The green effect on supply means green investor beliefs increase firm size but decrease firm Sharpe ratios. This is a concern for many investors as it suggests a return sacrifice for sustainable investing. However, the green effect on demand means that firms with management and investors who believe in the firms’ non-financial value will be larger in size and have higher Sharpe ratios. Thus, the green demand effect pushes Sharpe ratios (and expected returns) in the opposite direction of the green supply effect.
Application of the model
To see how these effects might play out in a real economy I calibrated a model economy with 100 industries and two types of investors: normal ‘financial-only’ investors and green investors.
I focused on climate change for this example simply because it is the most popular, if not most important, sustainable investing issue of our times. In general, of course, there are a wide range of other important impacts to also consider, including other environmental issues, social inequalities, and long-term trends such as AI and biotech's impacts on society.
I randomly assigned each of the firms a greenhouse gas (GHG) emissions intensity (tonnes per dollars revenue) in line with the observed distribution reported by Urgentem. Total investor wealth was set at $399 trillion. The firm financials were then set so that in normal equilibrium, with no green investors, the total emissions across the economy matched the world’s current 50 billion tonnes.
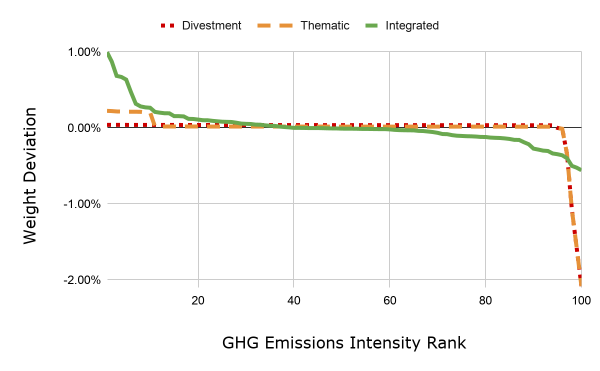
Then I examined the effect if 1% of investors follow one of three socially responsible investment strategies (and 99% financial-only investors). Under ‘Divestment’ the green investors allocate no capital to the worst emitters, pushing up the supply curve for these firms. Under ‘Thematic’ the green investors both divest and reinvest in the greenest firms (those that match the ‘green theme’). Finally, under ‘Integrated’ the green investors tilt their allocation across all firms based on each firm’s emissions and they engage with the (green) firms to encourage them to raise more capital.
Figure 2 shows the difference between the green investors weights and the normal equilibrium weights for each strategy.

Figure 2: The deviations of the weights of the green investors from their weights in the normal equilibrium,
for each of the 100 industries and each of the green strategies.
The impacts of each strategy on total economy-wide emissions and the associated investor portfolio returns are shown in Table 1. Each of the socially responsible investment strategies does result in net lower emissions across the economy, with the fully Integrated strategy having the biggest effect.

Table 1: Effects and results of green investors in equilibrium.
The Sharpe ratio of the green investors’ portfolio decreases slightly for each strategy. This is to be expected as fundamentally the financial-only investors are optimizing for their Sharpe ratios, so it is not possible for the green investors to do better when they are also optimizing for their non-financial green beliefs. However, this doesn’t necessarily mean that green investors do bad financially.
With all three strategies the value of the green investors portfolio increases in equilibrium. With Divestment and Thematic, this arises principally as a self-fulfilling prophecy where the green investors' overweight position in certain firms causes the equilibrium value of these firms to increase. Hence, the green investors portfolios have a higher value in the new equilibrium. In the case of Integrated, the green investors borrow from the other investors to fund investments in scaling up greener firms. This leads to value for the green investors as the firms offer good returns for this scaleup capital. Of course, this leveraged value comes with higher risk, as indicated by the Integrated strategy’s volatility.
The expected excess returns and weighted average Sharpe ratios illustrate the supply and demand effects of the general equilibrium model. Divestment and Thematic have slightly lower returns and Sharpe ratios because I have assumed they are passively applied by secondary market green investors on the supply, and are not actively applied to the demand side. Hence, as per Figure 1, lower Sharpe ratios are to be expected. Integrated assumes the green investors have incorporated social responsibility and ESG practices into both their primary and secondary markets investing, driving the demand curve. Again, as per Figure 1, this means higher Sharpe ratios are to be expected for many firms under Integrated.
Limitations
It is important to be clear about the limitations of any model. For the model I use for this study the limitations include that it is a single-period model, it assumes perfect investor knowledge, it assumes both types of investors have the same risk aversion and financial beliefs (whereas more altruistic investors should probably be less risk averse, and may genuinely believe green firms will be more profitable), it ignores the potential of firms to adapt and change their ‘greenness’, and it assumes that there are no transaction costs or short-selling constraints.
Of course, no model is perfect, and the one I used here can be improved with further research. However, I would argue that models like this, that combine investment and production decisions, are the minimum required to validly assess socially responsible investing on its own terms at what it seeks to do: use investment to change production.
Discussion and conclusion
My results show that, in theory, we should expect socially responsible investing to have some impact. Furthermore, it is not necessarily the case that green investors must sacrifice returns or value, though overall portfolio Sharpe ratios do appear to suffer. However, my results should not be taken as an indication that socially responsible investing can ‘save the world’. Rather, it is just one tool that asset owners can use in their stewardship of capital.
While the results can be very positive, and good for returns, they are also limited. With 1% of investors following an integrated green strategy, emissions were only reduced by 0.07%. It is reasonable to expect that grants to highly effective environmental organizations could have achieved the same impact with just $10-100 million. This compares very favorably versus the $3.9 trillion the green investors control in the model. Thus, for organizations that have the ability to make grants, they are a complementary highly effective tool.
That said, many investors can’t or won’t engage in grantmaking. Also, spending a substantial fraction of the green investor’s wealth on grants would likely overwhelm the most effective environmental organizations room for more funding. So, the potential impact of socially responsible investing seems better than no impact. Furthermore, early adopters can increase (and they have) their own effectiveness by encouraging other investors to integrate responsible considerations into their total portfolio management.
Ultimately what matters is what produces the best result for society in the long run. Even with a more highly developed economic model we won’t know for sure. All of these approaches (divestment, thematic, integrated) have potential to help in their own way. It seems good that people are working towards improving their socially responsible investment practices using all these approaches and more. However, it seems most promising to increase integration of sustainable investing criteria in private markets, driving the demand curve for green companies in the right direction.
References
Betermier, S., L. Calvet, E. Jo, 2020, A Supply and Demand Approach to Equity Pricing, Working Paper.
Heeb, F., J. Kölbel, 2020, The Investor’s Guide to Impact: Evidence-based advice for investors who want to change the world, Center for Sustainable Finance and Private Wealth, University of Zurich.
Heinkel, R., A. Kraus, J. Zechner, 2001, The Effect of Green Investment on Corporate Behavior, Journal of Financial and Quantitative Analysis.
Pastor, L., R. F. Stambaugh, and L. A. Taylor, 2020, Sustainable Investing in Equilibrium, Journal of Financial Economics, forthcoming.

